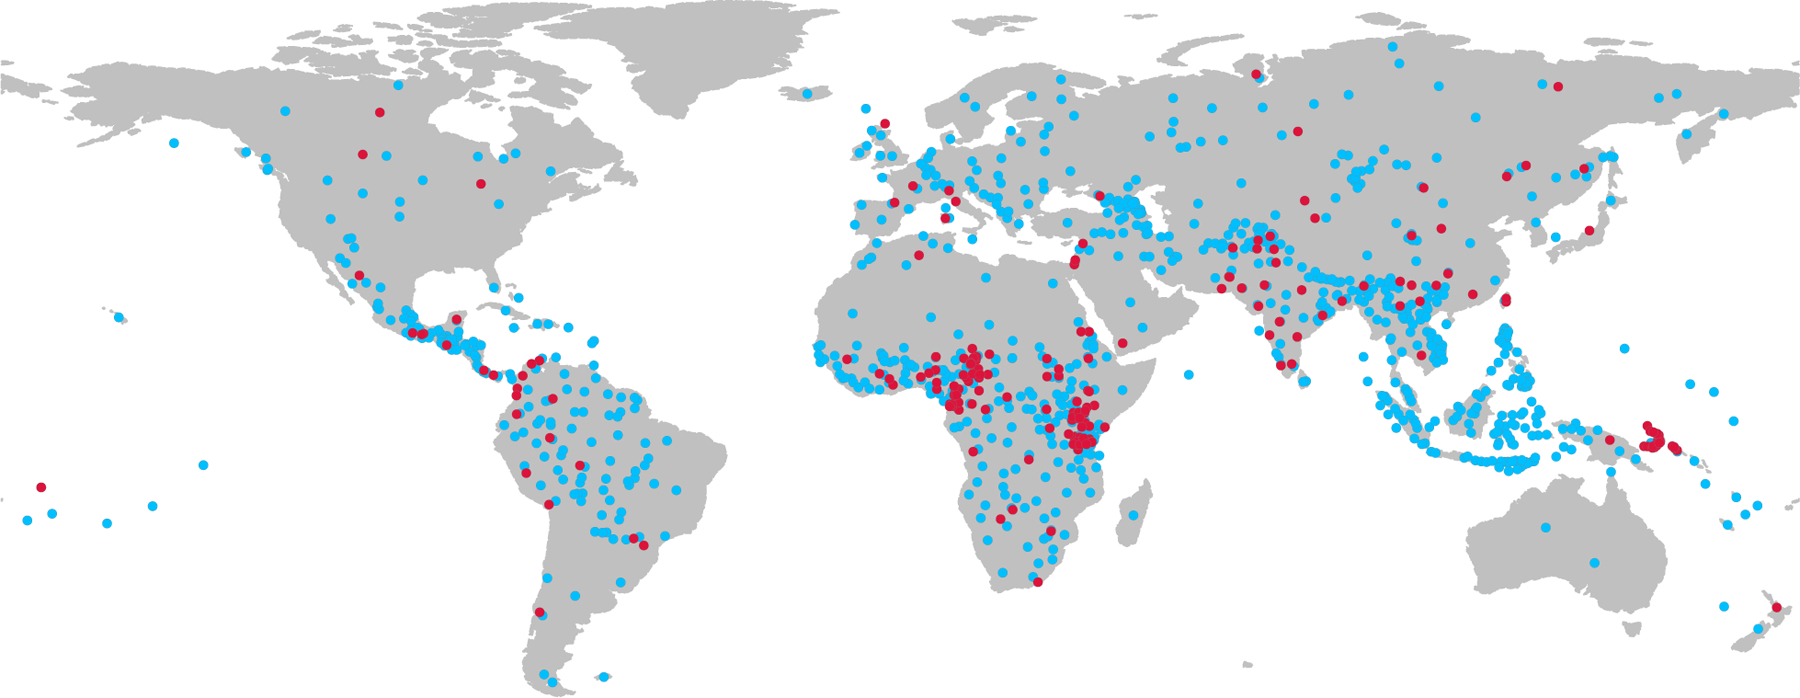
Figure 3: The Spatial Distribution of Ethnic Homelands.

Notes: This map depicts the global spatial distribution of ethnic homelands in the sample. Each point represents the centroid of the historical homeland of an ethnic group. Red points depict homelands for which population diversity is observed, whereas blue points depict homelands for which population diversity is predicted.
