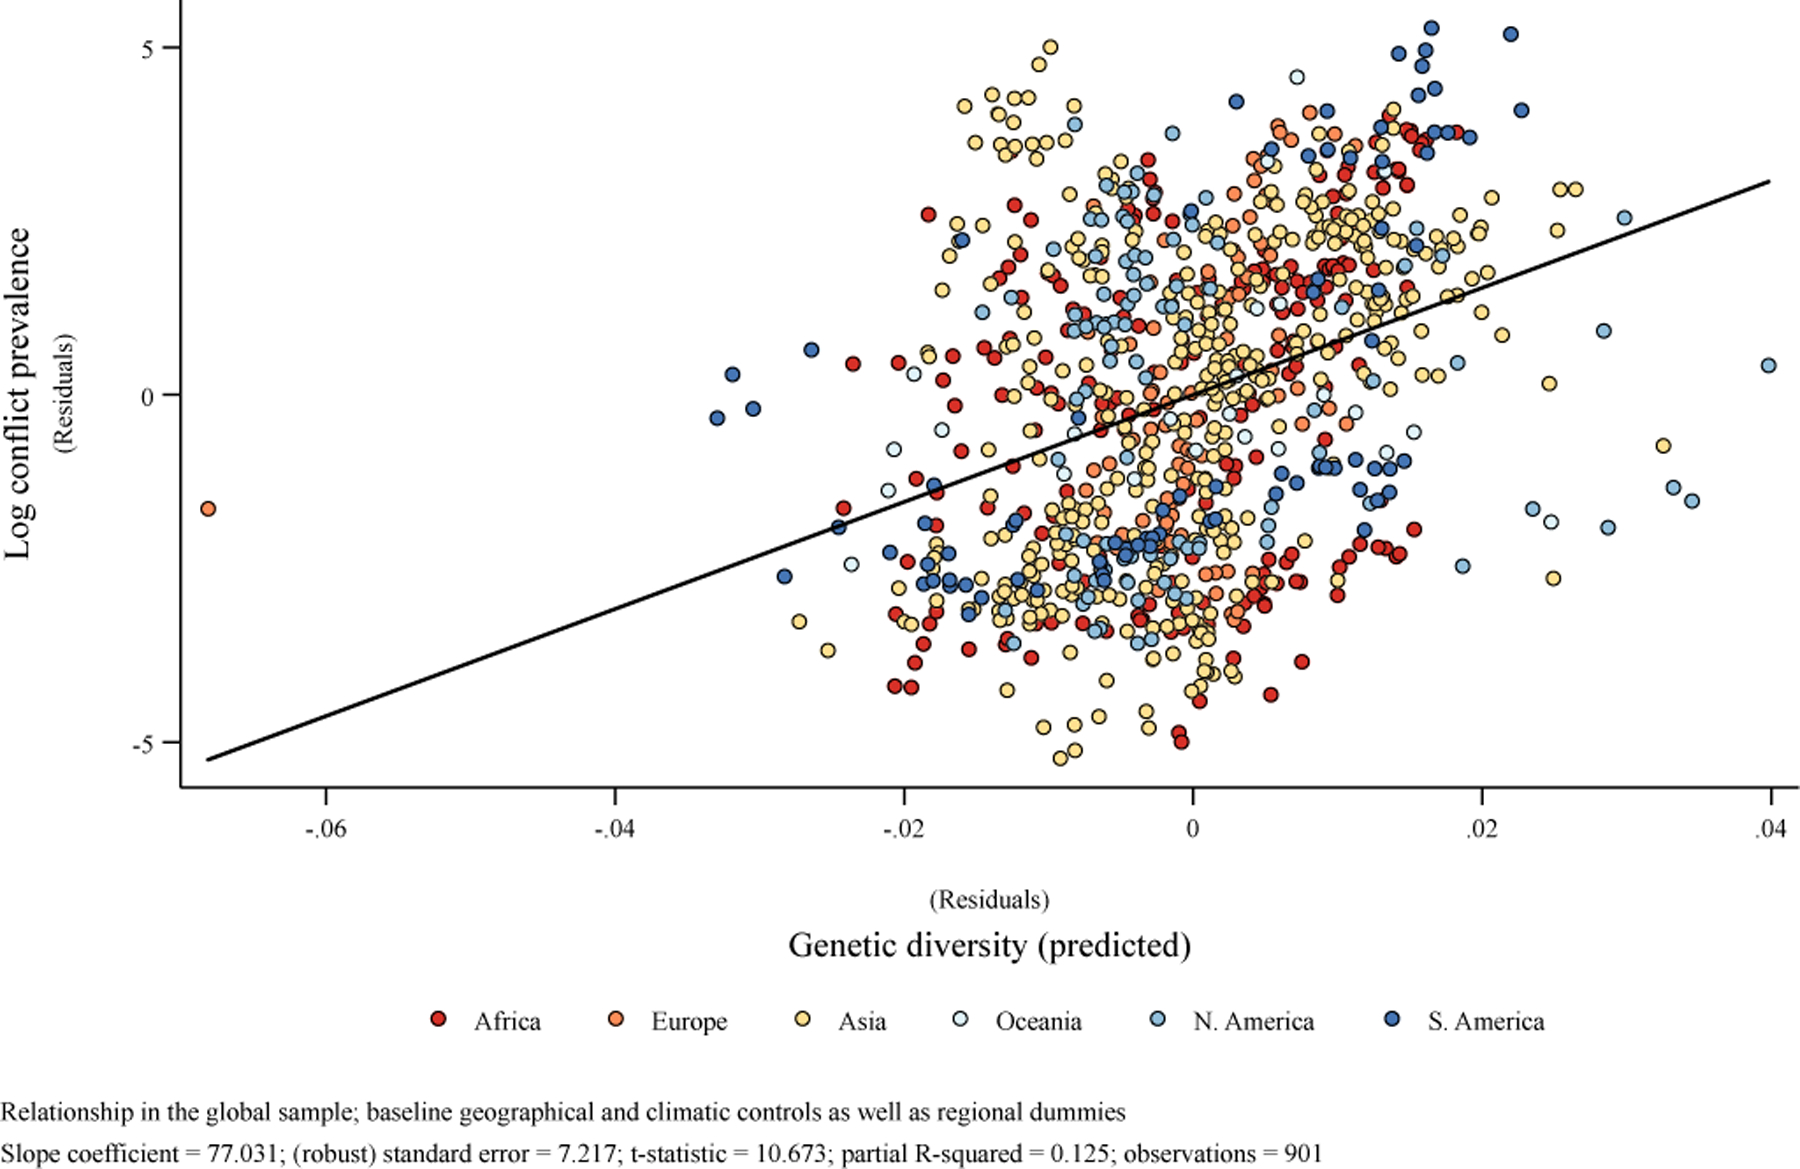
Figure 6: Predicted Population Diversity and Conflict across Ethnic Homelands.

Notes: This figure depicts the relationship between predicted population diversity and conflict prevalence during the period 1989–2008 across 901 ethnic homelands, conditional on world-region fixed effects, and potential geographic and climatic confounders, as reported Column 2 of Table VI.
