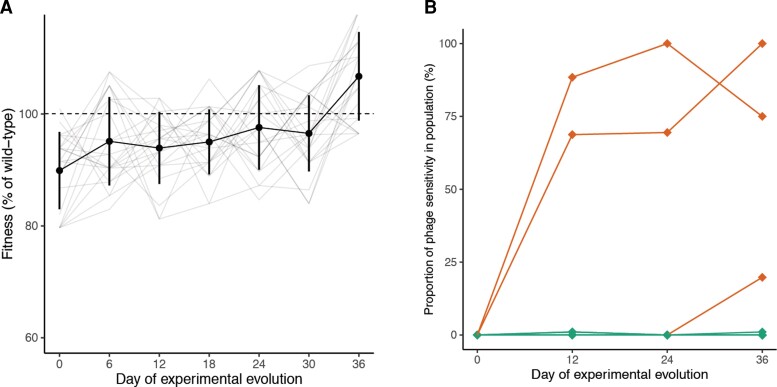
Fig. 2.
Phenotypic changes in bacterial populations during experimental evolution in the absence of phages. (A) Population growth rates of populations inoculated with phage-resistant colonies over experimental evolution in the absence of phages, calculated based on optical density measurements in a microplate reader over 40 h of growth (n = 22). Lines represent the trajectories of individual populations over time, whereas points indicate the mean fitness among populations sampled at the same day and error bars indicate SD. Values are normalized to the growth rates of the phage-sensitive control populations sampled at the same point in experimental evolution. (B) Proportion of colonies in each population that were scored as phage-sensitive over time, as indicated by disruption in bacterial growth upon encountering phage on an agar plate (n = 22 populations with 96 colonies sampled per population). Orange lines indicate populations from which sensitive colonies were isolated and verified in a microplate assay.

