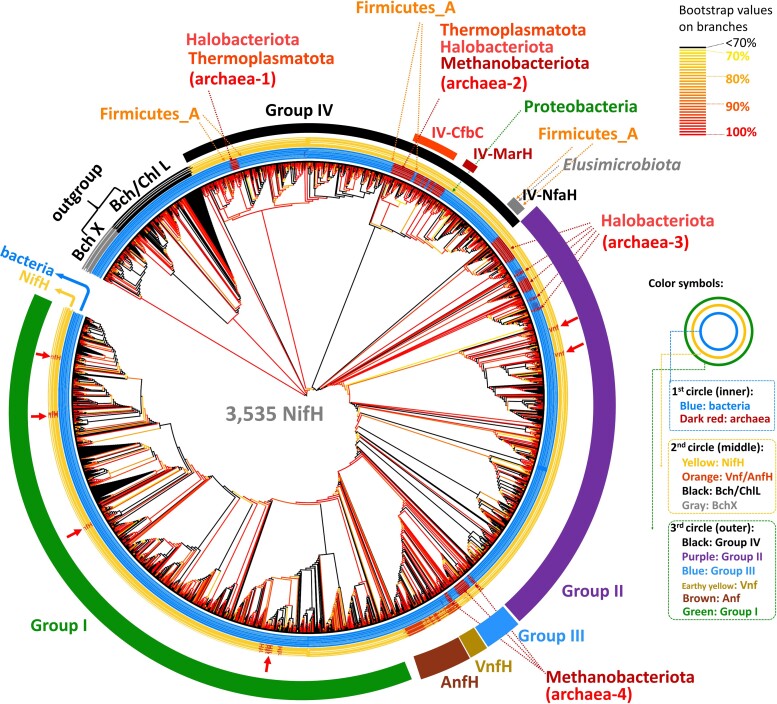
Fig. 2.
Expanded phylogeny of Nif/Vnf/AnfH sequences. Figure 2 is an expanded version of figure 1. Branches are colored according to their bootstrap values; see the color bar on the top left. Bacteria and archaea are labeled in blue and dark red on the first (inner) circle. In the second circle, NifH is labeled by yellow while Vnf/AnfH by orange. The protein sequences are classified into Groups I, II, III, IV, Vnf, and Anf, which are labeled in different colors on the third (outer) circle. We use the IQ-TREE method to reconstruct the phylogenetic tree and ModelFinder to select the best-fit model of protein sequence evolution with ultrafast bootstrap (1,000 replicates). The model selected is LG + R10.

