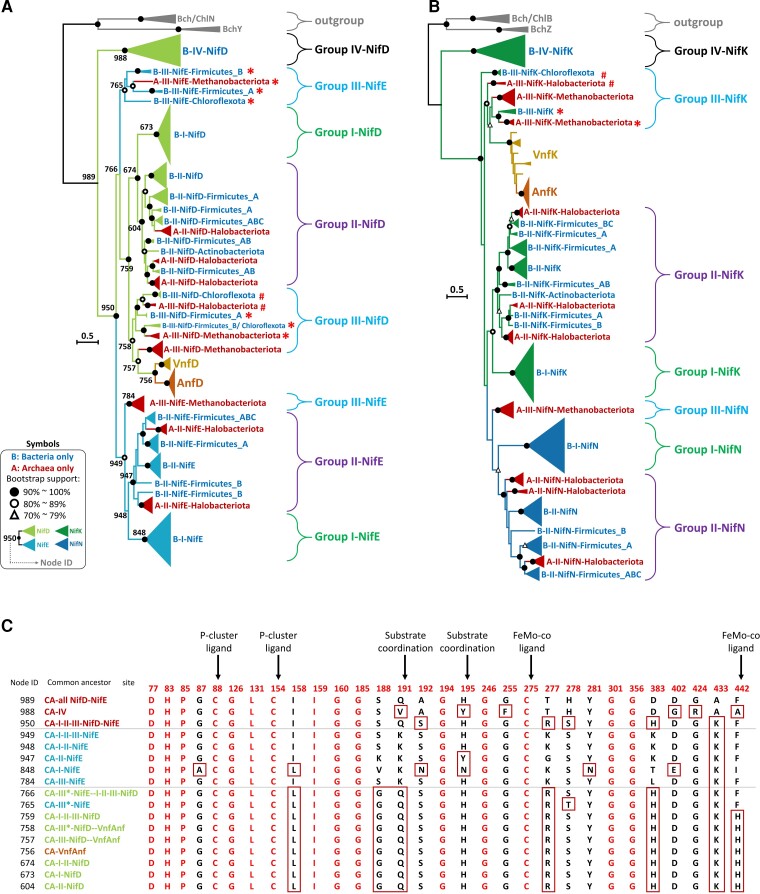
Fig. 5.
Phylogenies of NifD and NifK sequences and of NifE and NifN sequences. (A) The phylogeny of 487 Nif/Vnf/AnfD and E sequences. (B) The phylogeny of 476 Nif/Vnf/AnfD and E sequences. The scale bar denotes 0.5 amino acid substitutions per residue site. The solid and empty black circles denote the bootstrap values of 90–100% and 80–89%, respectively, and the empty triangle denotes a bootstrap value of 70–79%. The protein sequences are classified into Groups I, II, III, IV, Vnf, and Anf. We label archaeal groups by dark red. The four-nif-gene set is labeled by # and the five-nif-gene set is labeled by *. We use 6 BchY, Z sequences and 10 Bch/Chl N, B sequences as the outgroup. (C) The ancestral sequences at the branch nodes numbered in (A). The residues on the sequences are numbered according to the Azotobacter vinelandii proteins. We use the full-version ML method to construct the tree and ModelFinder to select the best-fit model of protein sequence evolution with bootstrap (500 replicates). The model selected is LG + G.

