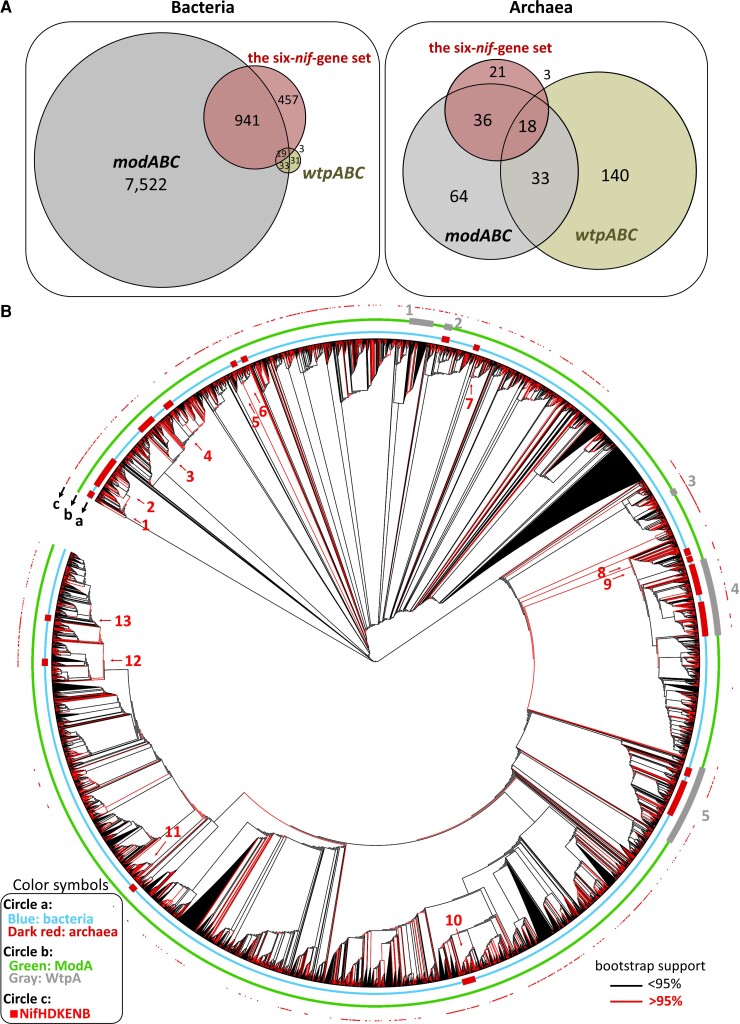
Fig. 8.
The distribution of ModABC and WtpABC in bacteria and archaea, and the phylogeny of ModA and WtpA sequences. (A) The Venn diagrams of Nif species (red color), modABC-gene-harboring species (gray color) and wtpABC-gene-harboring species (olive green). (B) The phylogeny of 10,119 ModA and 829 WtpA sequences. In Circle a, the bacterial groups are labeled by blue and the archaeal groups by dark red. In Circle b, ModA groups are labeled by green and WtpA groups by gray. In Circle c, the Nif species are labeled by small red squares. The tree is unrooted, but for simplicity of presentation we took one group of ModA sequences as the outgroup. The number of ultrafast bootstrap replicates was 1,000. A red line (branch) means a bootstrap value of ≧95%, whereas a black line means a bootstrap value of <95%.

