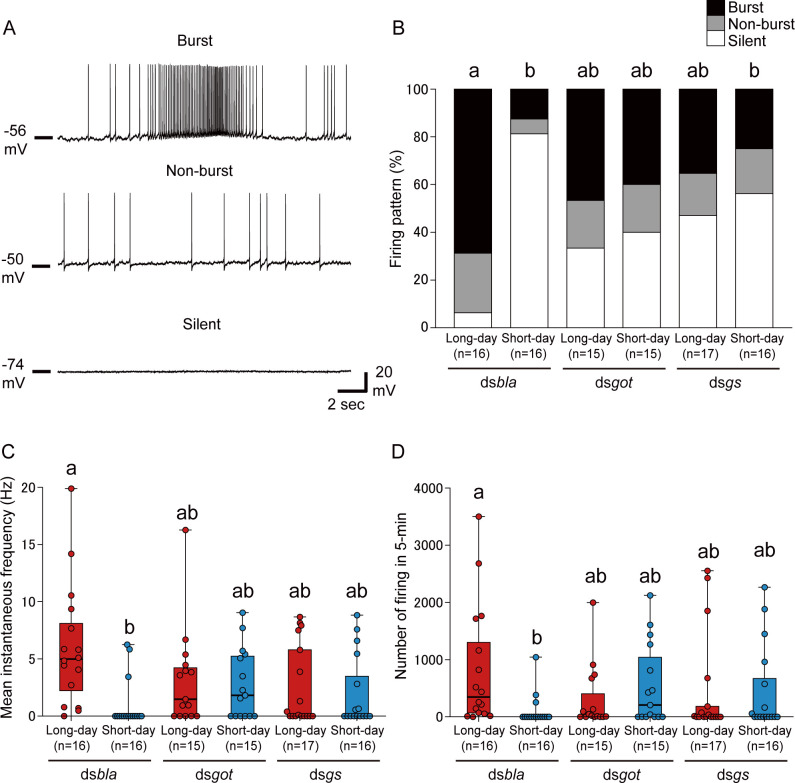
Fig 3. RNAi of got and gs disrupts photoperiodic responses in large PI neurons.
(A) Representative traces showing burst (upper), non-burst (middle), and silent (lower) patterns in PI neurons. (B) Columns showing proportions of the 3 firing patterns in dsbla-, dsgot-, and dsgs-injected females under long-day and short-day conditions. (C, D) Box and scatter plots showing the (C) mean instantaneous frequency and (D) number of firing events in 5 min in each group. (B–D) Columns and box plots with different letters indicate statistically significant differences (B: Tukey-type multiple comparisons for proportions [“silent” rate comparison]; C, D: Steel–Dwass test, P < 0.05). (C, D) Lines at the top, middle, and bottom of the box plots indicate the upper quartile, median, and lower quartile, respectively. Upper and lower whiskers of the box plots indicate the maximum and minimum values, respectively. The underlying data can be found in the S1 Data datasheet of numerical values for each fig.xlsx. PI, pars intercerebralis; RNAi, RNA interference.

