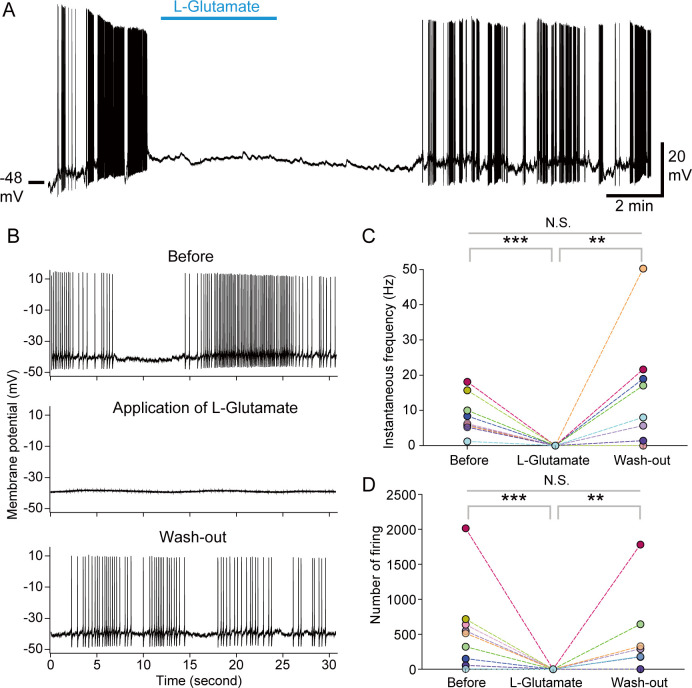
Fig 4. Perfusion of L-Glutamate acutely and strongly inhibits the spontaneous firing activity of PI neurons.
(A) A representative trace showing effects of 1 mM of L-Glutamate perfusion on the spontaneous firing activity of PI neurons. (B) Traces showing the spontaneous activity of a PI neuron before the perfusion of glutamate (upper), during application of glutamate (middle), and after wash-out (lower). (C, D) Line graphs showing the (C) instantaneous frequency and (D) number of firing events in 3 min of “Before,” “L-Glutamate,” and “Wash-out” within each PI cell (n = 9). We performed repeated Friedman test with post hoc Steel–Dwass test. Repeated Friedman test shows statistically significant differences in the instantaneous frequency and number of firing events (P < 0.01). Symbols show statistical P values by Steel–Dwass test (**: P < 0.01, ***: P < 0.001, N.S.: not significant). The underlying data can be found in the S1 Data datasheet of numerical values for each fig.xlsx. PI, pars intercerebralis.

