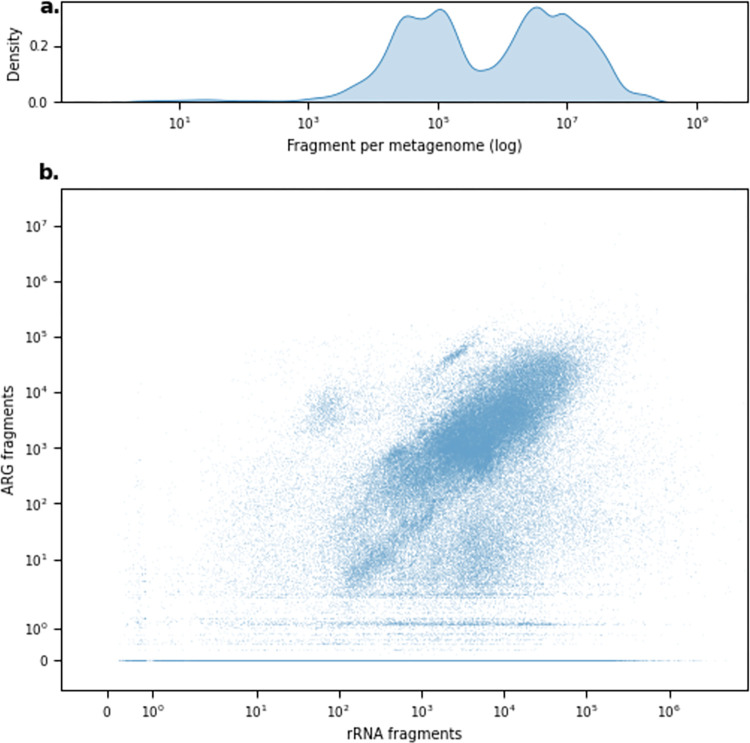
Fig 2. Distribution of available and aligned fragments.
(a) Density distribution of available fragments per sample. (b) The distribution compares the number of fragments mapped to rRNA genes and ARGs. The data underlying this figure can be found at https://doi.org/10.5281/zenodo.6919377.

