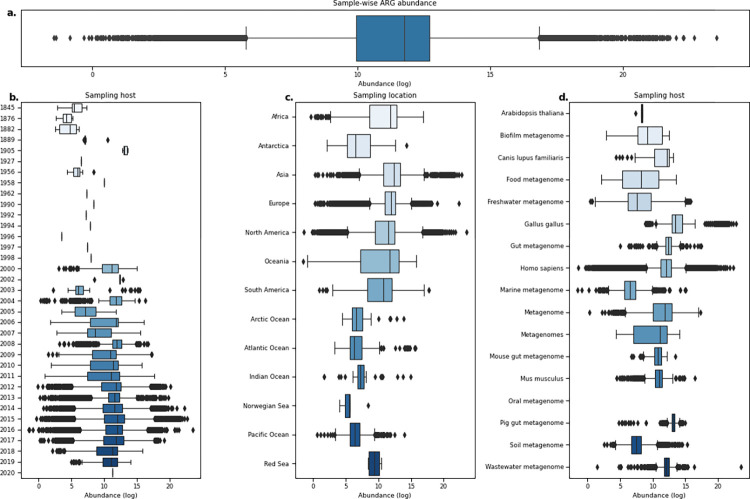
Fig 3. Boxplots of ARG abundances in metagenomic samples show that levels vary across different origins.
(a) Distribution of ARG abundance per sample. (b) Distribution of sample-wise ARG abundance grouped by sampling year. (c) Sample-wise ARG abundance per sampling location. (d) Sample-wise ARG abundance grouped by hosts. Only hosts with more than 1,000 metagenomes analyzed are shown. The data underlying this figure can be found at https://doi.org/10.5281/zenodo.6919377.

