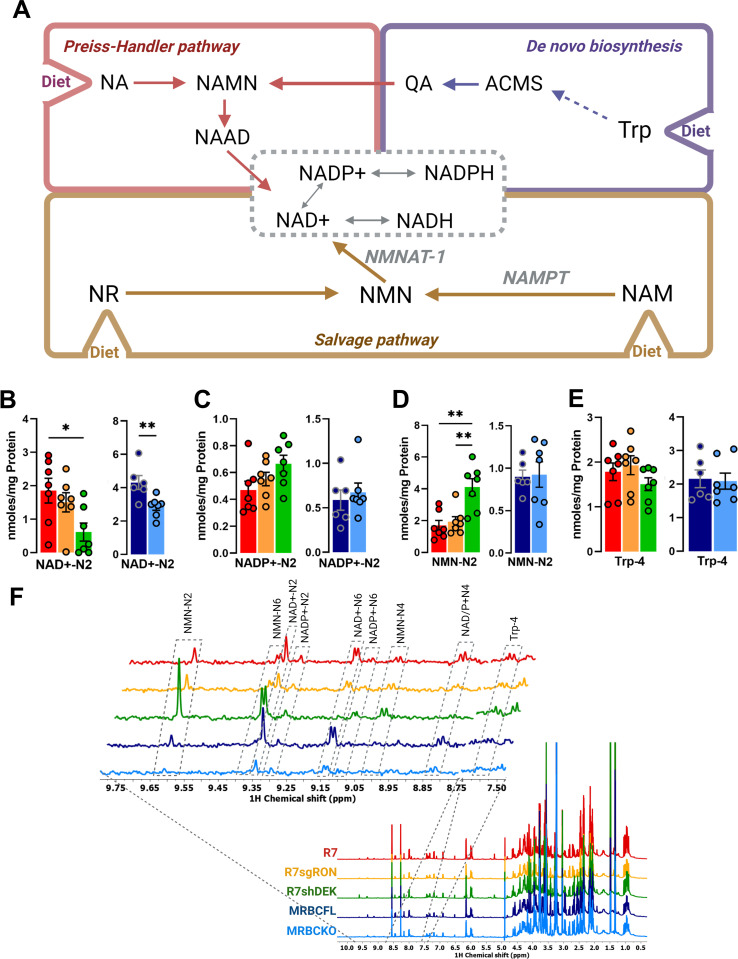
Fig 3. NAD+ production pathway modulation by the RON-DEK-β-catenin axis.
(A) Schematic of NAD+ production pathways including de novo synthesis and salvage pathways (created with BioRender.com) illustrating the trends of R7 (red), R7sgRON (orange), R7shDEK (green), MRBC FL (dark blue), and MRBC KO cell lines (light blue). (B) Intracellular NAD+ levels. (C) Intracellular NADP+ levels necessary for de novo synthesis of NAD+. (D) Intracellular nicotinamide mononucleotide (NMN) levels. (E) Intracellular tryptophan (Trp) levels (F) Comparison of representative 1D 1H-NOESY spectra of the polar extract from R7, R7sgRON, R7shDEK, MRBC FL, MRBC KO cell lines. 1H NMR spectra were recorded at 600 MHz spectrometer and processed as described in the Methodology section. Full spectrum (ɗ 0.5–10 ppm) (bottom); expansion of spectra of the 8.75–9.75 ppm and 7.50–7.60 ppm regions (top) showing the nicotinamide ring resonances of nicotinamide mononucleotide (NMN), NAD+, NADP+ and Tryptophan (Trp), respectively. Bar graphs indicate mean and the error bars represent SEM of replicates. Replicates of each cell line are shown as individual dots (n = 6–7). Statistical significance was assessed using one- way ANOVA and two-tailed Student’s t-test for R7 and MRBC comparisons, respectively. *P ≤ 0.05; **P ≤ 0.01; ***P ≤ 0.001; ****P ≤ 0.0001.

