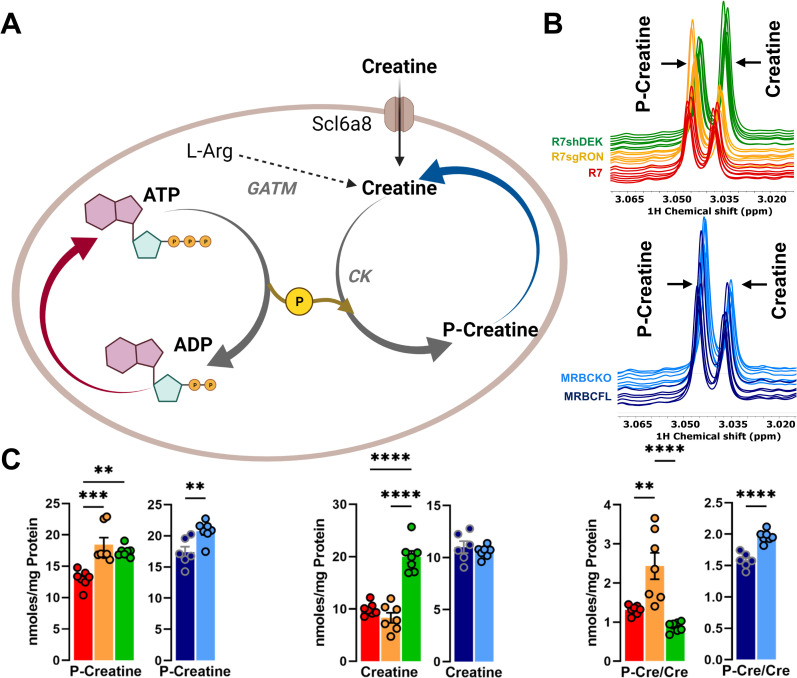
Fig 4. Creatine dynamics modulation by the RON-DEK-β-catenin axis.
(A) Schematic of creatine dynamics (created with BioRender.com) illustrating the trends of R7 (red), R7sgRON (orange), R7shDEK (green), MRBC FL (dark blue), and MRBC KO cell lines (light blue). (B) Representative 1H-NMR spectra of phospho-creatine (p-creatine) and creatine for R7, R7sgRON, and R7shDEK (top) and MRBC FL and MRBC KO (bottom) samples. (C) Intracellular levels of p-creatine, creatine, and p-creatine/creatine ratios. Bar graphs indicate mean and the error bars represent SEM of replicates. Replicates of each cell line are shown as individual dots (n = 6–7). Statistical significance was assessed using one-way ANOVA two-tailed Student’s t-test for R7 and MRBC comparisons, respectively. *P ≤ 0.05; **P ≤ 0.01; ***P ≤ 0.001; ****P ≤ 0.0001.

