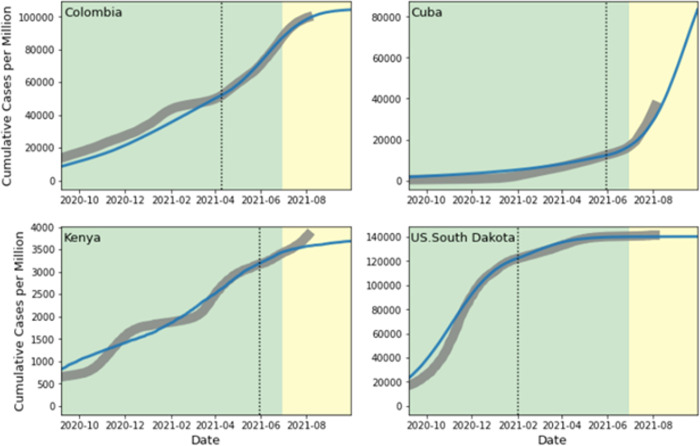
Fig 2. Model fitting for selected countries.
Model fitting (shaded green) and out-of-sample validation (shaded yellow) in four selected countries. The grey curves are the observed cumulative cases per million, and the blue curves are the simulated results. The dotted lines signal the days when traveling, vaccination, and regional demographic characteristics are added to the simulations.

