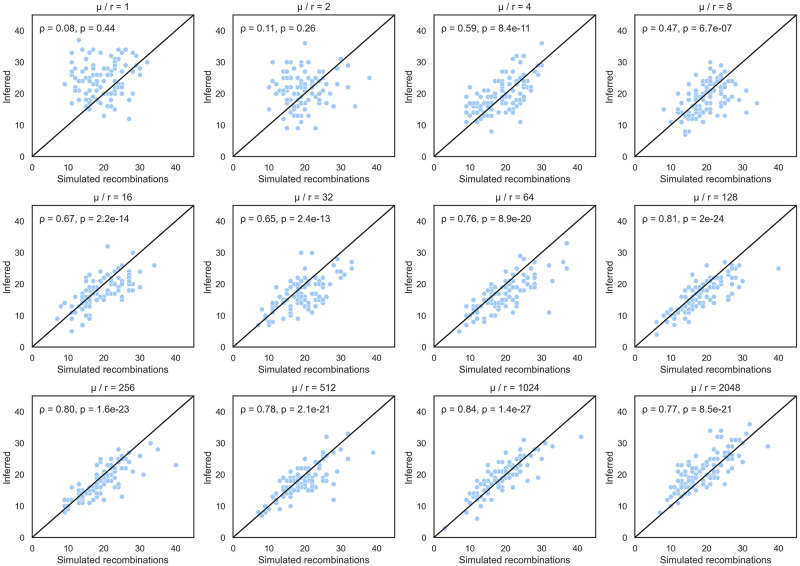
Fig 3. Simulated number of recombination events versus number inferred by ARGweaver under different ratios of mutation rate / recombination rate.
Each diagonal line is x = y. ρ and p are the correlation coefficient between the simulated and estimated number of events and corresponding p-value, respectively. We selected the ARG sampled by ARGweaver during the final MCMC iteration to count the number of recombination events.

