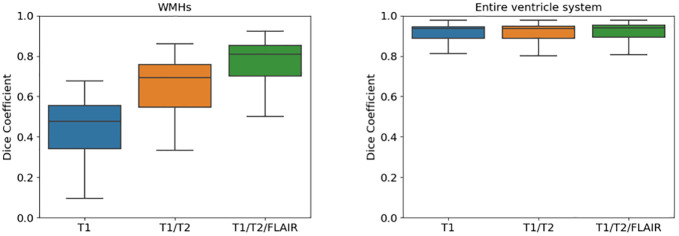
Fig 8. Boxplots comparing the DSC when using different number of input sequences in the proposed method.
The left plot shows WMHs and the right plot shows the ventricular system when generating segmentations from: 1) Only T1-w (blue), 2) only T1-w and T2-w (orange), and 3) T1-w, T2-w, and FLAIR images (green).

