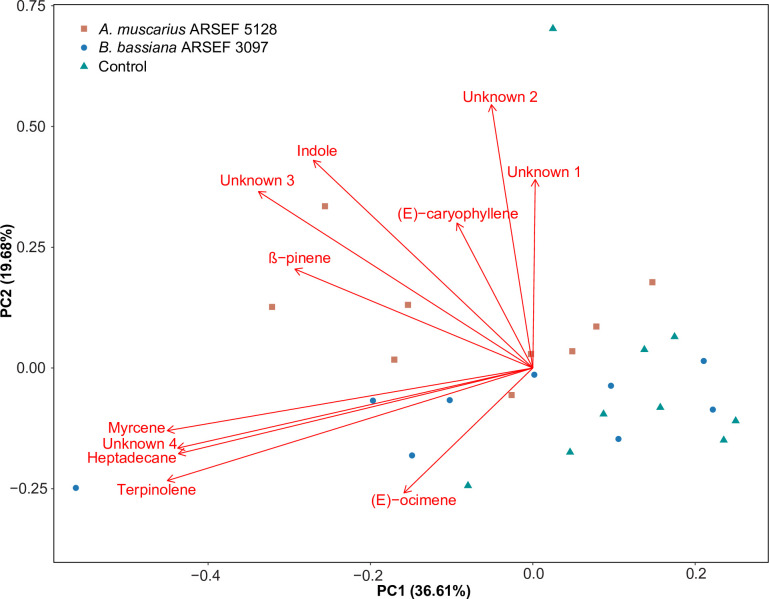
Fig 3. Principal component analysis (PCA) of plant volatiles emitted by sweet pepper plants inoculated with Akanthomyces muscarius ARSEF 5128 (orange) or Beauveria bassiana ARSEF 3097 (blue) or non-inoculated plants (green) (n = 9).
Volatiles were collected by dynamic headspace sampling for 48 h and identified by GC-FID/GC-MS. The plot visualizes the location of each analyzed sample on each PC with the percentage of explained variation in parentheses, whereas vectors (in red) visualize the loadings for each variable. Volatile composition differed significantly among treatments (F = 2.21, P = 0.035; perMANOVA).

