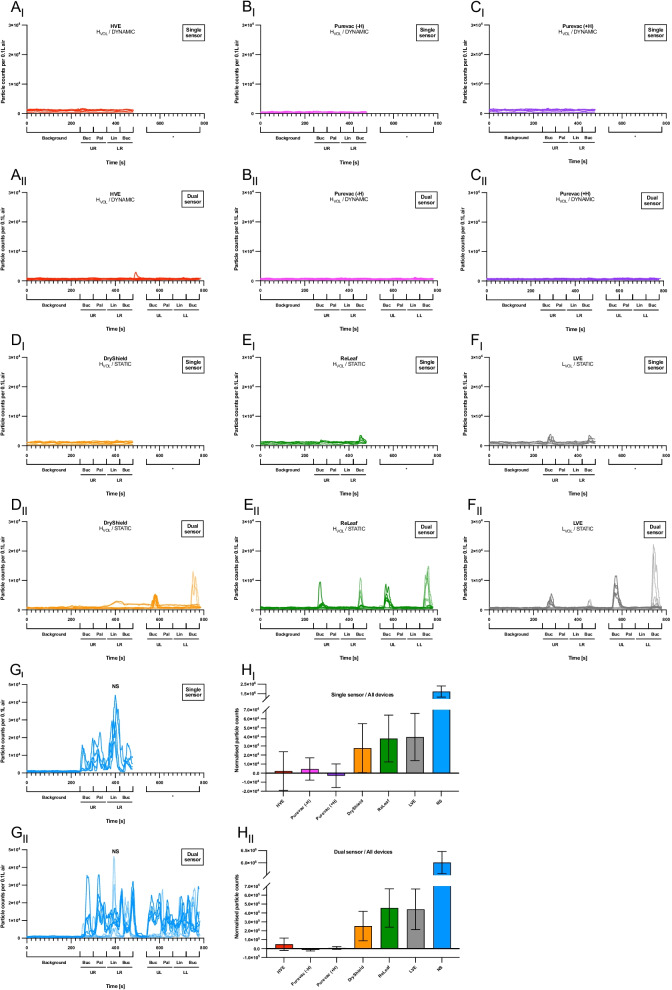
Fig. 2.
Particle counts for ultrasonic procedures. A-G, Line graphs showing particle count (> 0.3 µm/0.1 L air) over time for the ultrasonic procedures in the single (i) and dual sensor (ii) setups. A, Standard high-volume suction (‘HVE’). B, Purevac® HVE Mirror Tip connected directly to the suction port (‘Purevac (−H)’). C, Purevac® HVE System which included the lightweight hose and adapter (‘Purevac (+H)’). D, Standard low-volume suction (‘LVE’). E, Ivory® ReLeaf™ hands-free suction device (‘ReLeaf’). F, DryShield® isolation system (‘DryShield’). G, No suction. Each line on the graphs represents one replicate. H, Bar charts showing normalised particle counts (mean ± SD, n = 5) for the ultrasonic procedures. Statistical analysis shown in Table 1

