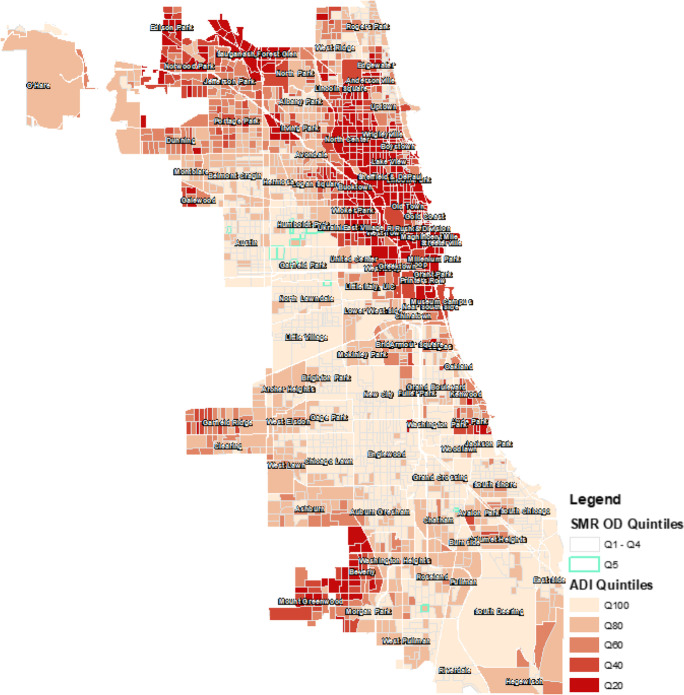
Fig. 5.
Standardized mortality ratios and Area Deprivation Index quintiles by census block group in the city of Chicago. The CBGs that are outlined in green correspond to the highest SMR quintile (Q5) or the area with the greatest risk of a fatal drug overdose. The lighter reddish-brown shading corresponds to the most deprived CBGs. The neighborhood boundaries are overlaid onto the map. The map shows that the areas associated with the highest opioid-related fatality risk are in areas of highest deprivation

