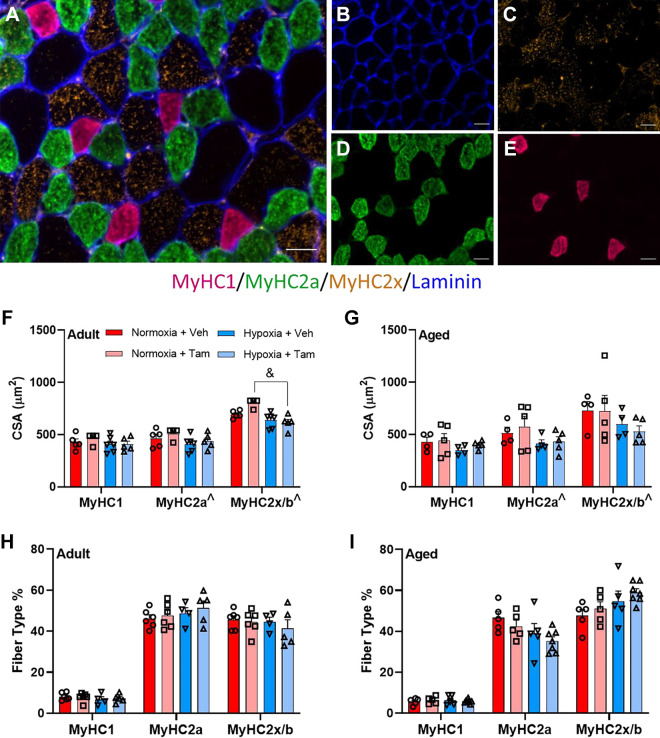
Figure 3.
Hypoxia, but not satellite cell depletion lowers MyHC2a and MyHC2x/b muscle fiber cross-sectional area with no impact on fiber-type distribution from hypoxia or satellite cell depletion. Representative images of fiber-type stain on diaphragm, merged (A), laminin (B), type IIx (C), type IIb (D), and type I (E); scale bars represent 25 µm. Fiber-type specific cross-sectional area of adult (F) and aged (G) mouse diaphragm. Fiber-type distribution of adult (H) and aged (I) diaphragm. ^Main effect for hypoxia in cross-sectional area of MyHC2a and MyHC2x/b fibers (P = 0.0157 and P = 0.0069, respectively). &Significant differences between groups, within fiber type. Adult normoxia veh group n = 5, adult normoxia tam group n = 6, adult hypoxia veh group n = 4, adult hypoxia tam group n = 5, aged normoxia veh group n = 5, aged normoxia tam group n = 5, aged hypoxia veh group n = 5, aged hypoxia tam group n = 7. Differences in fiber-type specific cross-sectional area and fiber-type distribution for MyHC1, MyHC2a, and MyHC2b/x were individually tested using two-way ANOVA with Šídák’s multiple comparison correction. Age effects were detected using three-way ANOVA. Error bars represent SE. MyHC, myosin heavy chain; tam, tamoxifen; veh, vehicle.

