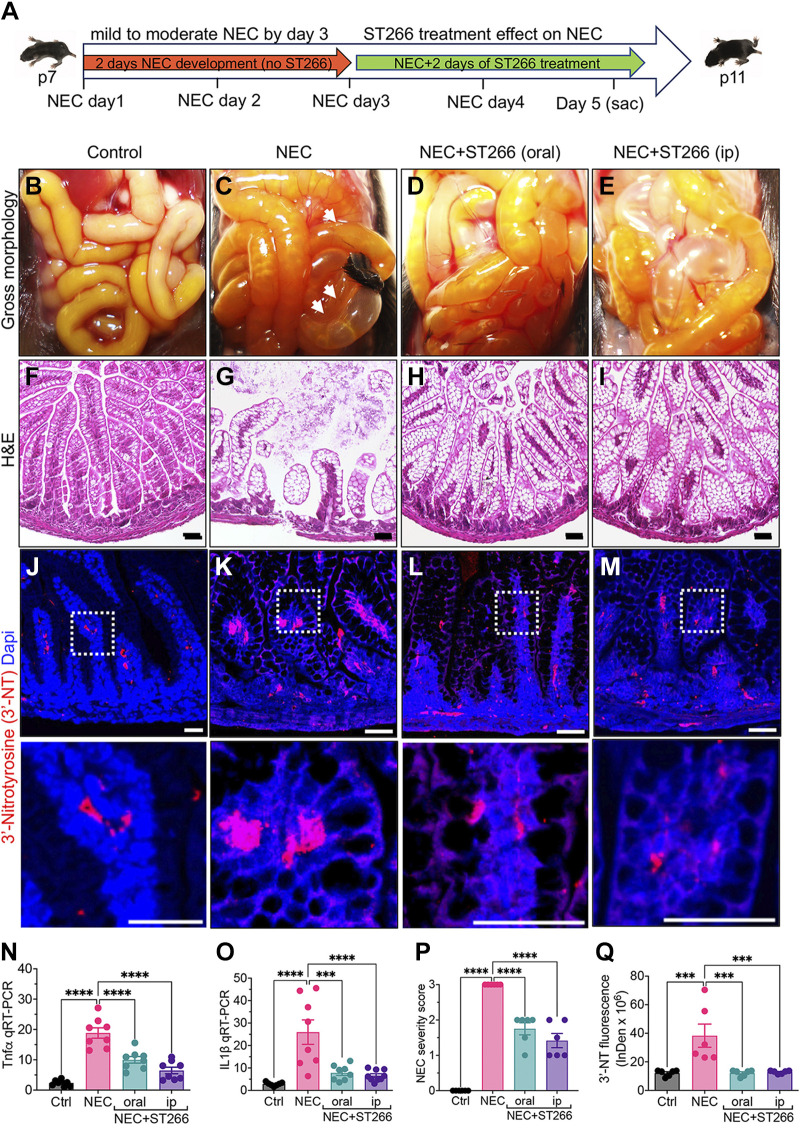
Figure 2.
The administration of ST266 reduces the severity of established NEC in mice. A: schematic illustration of the experimental protocol for the administration of ST266 in the NEC model in mice. Gross images of the small bowel of control (B), NEC (B), NEC mice given ST266 via oral route (D), and NEC mice given ST266 via intraperitoneal route (E). Representative H&E-stained histological images showing the intestinal mucosa of the terminal ileum in control (F), NEC (G), NEC mice given ST266 via oral route (H), and NEC mice given ST266 via intraperitoneal route (I). Representative confocal images of immunofluorescence staining of 3′-nitrotyrosine (3′-NT, red; Dapi-nuclei, blue) in the ileum of control (J), NEC (K), NEC mice given oral ST266 (I), and NEC mice given intraperitoneal ST266 (M). N and O: qRT-PCR expression of proinflammatory cytokines Tnfα and IL1β in the intestinal mucosa (n = 8 mice/group). P: representative NEC severity score (n = 6 mice/group). Q: quantification of fluorescent intensity of 3′-NT staining using the ImageJ software (n = 6 mice/group) Statistical significance was determined by one-way ANOVA followed by Tukey’s multiple comparisons tests using GraphPad Prism 9 software. *** or ****P < 0.001. Each dot on the graph represents a different mouse. Scale bars, 100 µm (F–I), 25 µm (J–M). H&E, hematoxylin and eosin; NEC, necrotizing enterocolitis.

