Figure 6.
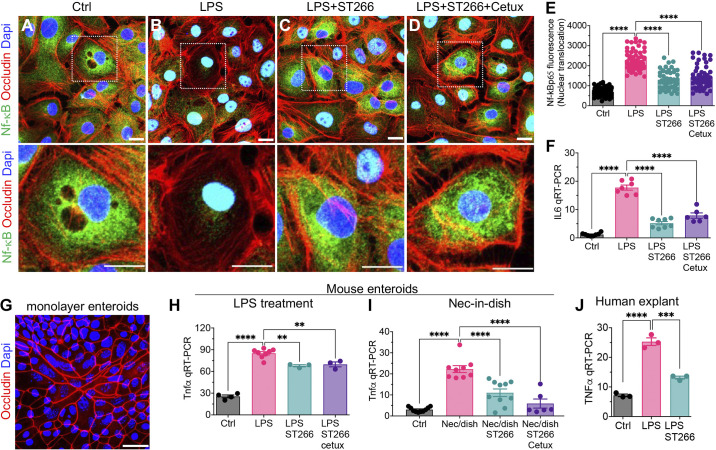
ST266 inhibits TLR4 signaling in intestinal epithelial cells (IECs) independent of EGFR signaling. A–E: IEC6 cells. Representative confocal images of IEC6 cells immunostained for NF-κB p65 after treatment with media (Control, Ctrl) (A), LPS (B), LPS+ST266 (C), and LPS + ST266 + Cetuximab (Cetux) (D). E: NF-κB p65 translocation from cytoplasm to nucleus assessed by quantifying NF-κB p65 fluorescence intensity in the nucleus using ImageJ software (each dot in the graph represents an individual cell, and cells were counted from n = 3 independent experiments). F: qRT-PCR expression of proinflammatory cytokine interleukin-6 (IL6) (n = 6–8, as indicated). G and H: primary intestinal enteroids. G: confocal image of enteroids grown to monolayer on fibronectin-coated wells stained for Occludin (red fluorescence) showing viability and integrity of the cultured primary epithelial cells. H: qRT-PCR expression of proinflammatory cytokine Tnfα (n = 3–8 as indicated). I: qRT-PCR expression of proinflammatory cytokine Tnfα in enteroids subjected to NEC-in-dish treatment model (n = 6–9). J: human ileal tissue; qRT-PCR expression of proinflammatory cytokine TNFα in deidentified resected human nonnecrotic (control) small bowel tissue subjected to ex vivo cotreatment with LPS and ST266 for 6 h (n = 3). Each dot in dot graphs of cell culture experiments represents data from an independent cell-culture well/experiment or an individual tissue specimen from mouse or human. Statistical significance was determined by one-way ANOVA followed by Tukey’s multiple comparisons tests using GraphPad Prism 9 software. 0.05, **P < 0.01, *** or ****P < 0.001. Scale bars, 10 µm. EGFR, epidermal growth factor receptor; LPS, lipopolysaccharide; TLR4, Toll-like receptor 4.

