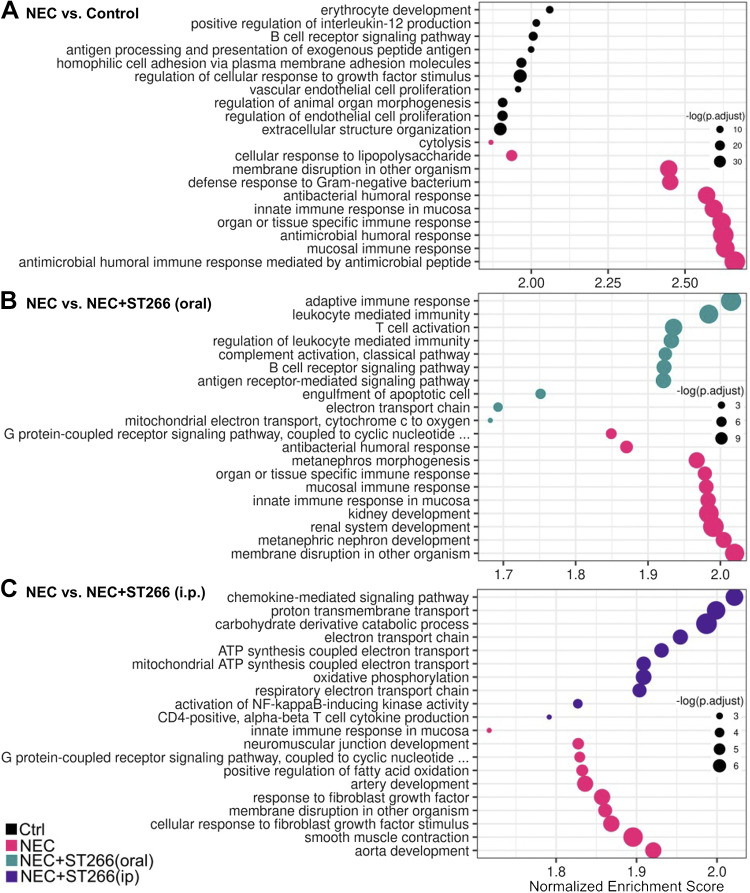
Figure 8.
ST266 treatment alters the expression pathway of key genes in the intestine of mice. Pathway analyses shown as bubble plots that represent the most upregulated pathways in each sample comparison. Comparisons include those between NEC mice and breastfed controls (A), NEC mice and NEC mice administered ST266 via oral route (B), and NEC mice and NEC mice administered ST266 via intraperitoneal route (C). Size of circle represents significance (P value). NEC, necrotizing enterocolitis.

