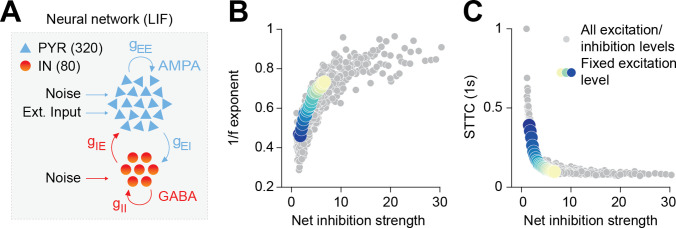
Figure 2. Increased inhibition leads to an increase in the 1/f exponent and decorrelates spike trains in a neural network model.
(A) Schematic representation of the neural network model. (B) Scatter plot displaying the 1/f exponent as a function of net inhibition strength. (C) Scatter plot displaying average STTC as a function of net inhibition strength. For (B) and (C) color codes for inhibition strength with fixed excitation level.

