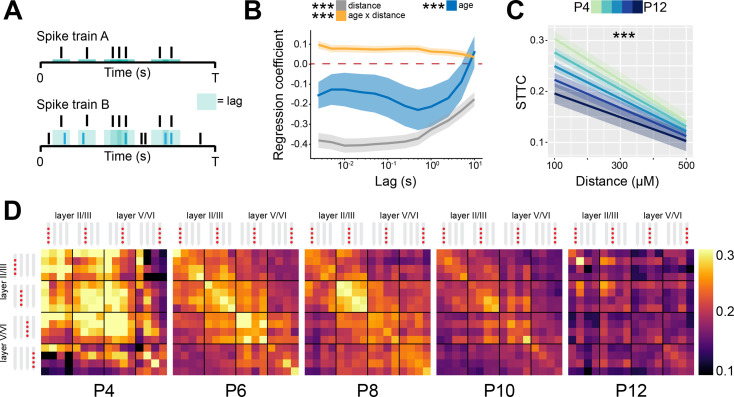
Figure 3. Spike time tiling coefficient (STTC) decreases throughout development with a specific spatial profile in the mouse medial prefrontal cortex (mPFC).
(A) Schematic representation of the STTC quantification. (B) Multivariate linear regression coefficients with respect to STTC lag (n=40,921 spike train pairs and 82 mice). (C) Average STTC at 1 s lag of P4, P6, P8, P10, and P12 mice over distance (n=40,921 spike train pairs and 82 mice). Color codes for age. (D) Weighted adjacency matrices displaying average STTC at 1 s lag of P4, P6, P8, P10, and P12 mice as a function of the recording sites in which the spike train pair has been recorded. Color codes for STTC value. In (B) regression coefficients are presented as mean and 95% CI. In (C) data are presented as mean ± SEM. Asterisks in (B) indicate significant regression coefficients of the respective (interaction between) variables for STTC at 1 s lag. Asterisks in (C) indicate significant effect of age*distance interaction. ***p<0.001. Linear mixed-effect models. For detailed statistical results, see Supplementary file 1.


