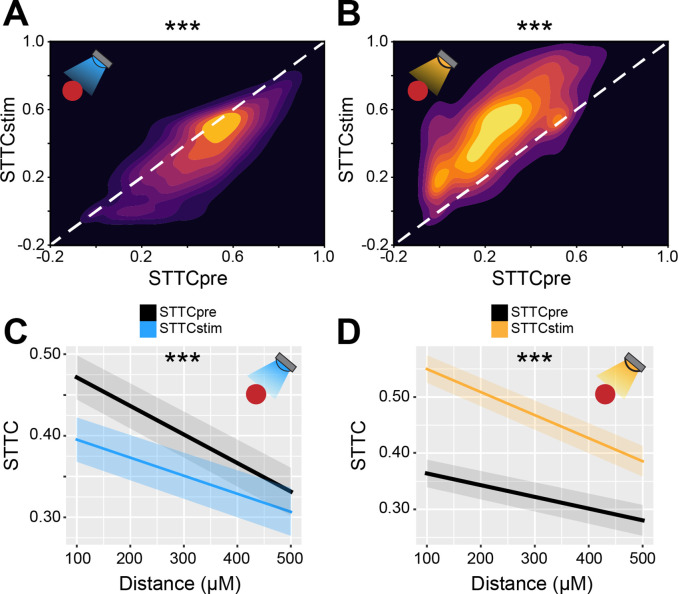
Figure 6. Bidirectional optogenetic manipulation of interneuron (IN) activity affects spike time tiling coefficient (STTC) in the developing mouse medial prefrontal cortex (mPFC).
(A and B) 2D kernel density plots displaying STTC before IN optogenetic manipulation (STTCpre) and STTC during optogenetic manipulation (STTCstim) during IN activation (A) and inhibition (B) (n=10,173 spike train pairs and 19 mice, n=9778 spike train pairs and 40 mice, respectively). (C and D) Average STTCpre and STTCstim during IN activation (C) and inhibition (D) over distance (n=10,173 spike train pairs and 19 mice, n=9778 spike train pairs and 40 mice, respectively). In (C and D) data are presented as mean ± SEM. Asterisks in (A and B) indicate significant effect of IN activation and inhibition, respectively. Asterisks in (C and D) indicate significant effect of IN activation*distance and IN inhibition*distance interaction, respectively. ***p<0.001. Linear mixed-effect models. For detailed statistical results, see Supplementary file 1.


