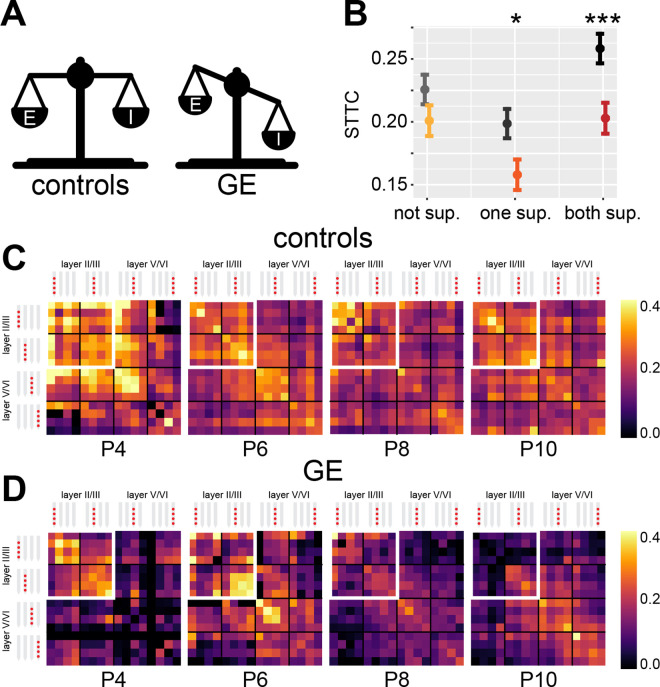
Figure 7. Genetic-environmental (GE) mice have reduced spike time tiling coefficient (STTC) values with specific spatial profiles.
(A) Schematic representation of the excitation-inhibition (E-I) ratio imbalance affecting GE mice. (B) STTC of control and GE mice (n=18,839 and 11,051 spike train pairs; 33 and 30 mice, respectively) with respect to the number of neurons in the superficial layers in the medial prefrontal cortex (mPFC). (C) Weighted adjacency matrices displaying average STTC at 1 s lag of P4, P6, P8, P10, and control mice as a function of the recording sites in which the spike train pair has been recorded (n=18,839 spike train pairs and 33 mice). White inset indicates STTC values between spike trains that are located in the superficial layers of the mPFC. Color codes for STTC value. (D) Same as (C) for GE mice (n=11,051 spike train pairs and 30 mice).


