
Author response image 1. Laser power across age and its effect on neuronal activity.
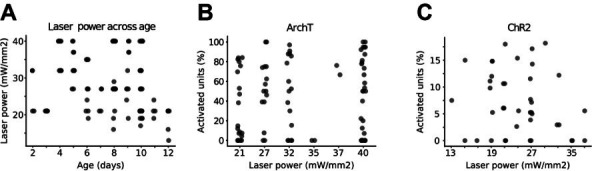
(A) Scatter plot displaying laser power with respect to age (n=59 mice). (B) Scatter plot displaying the percentage of activated units in ChR2 experiments with respect to laser power (n=19 mice). (C) Same as (B) for ArchT experiments (n=40 mice).