. 2022 Sep 6;11:e78416. doi: 10.7554/eLife.78416

Figure 1. Light-gated inward proton transport of a viral heliorhodopsin (HeR) from Emiliania huxleyi virus 202 (V2HeR3).

(A) Phylogenetic tree of HeRs, which includes three viral HeRs from E. huxleyi 202 (V2HeR1-3), a eukaryotic HeR from E. huxleyi (Ehux-HeR), an archaeal HeR (TaHeR) and a bacterial HeR (48C12). (B) eGFP fluorescence (top, green) and immunofluorescence staining (bottom, magenta) observation of V2HeR3 with a cMyc epitope tag at the C terminus (left) and the N terminus (right) in cultured ND7/23 cells. Scale bar, 20 μm. (C) Electrophysiological measurements of V2HeR3-driven photocurrent in ND7/23 cells. The cells were illuminated with light (λ=505 nm, 24.5 mW/mm2) during the time region shown by the blue bars. The membrane voltage was clamped from −60 to +60 mV for every 20 mV step. The pipette solution was 110 mM NMG-Cli, pH 7.4i, the bath solution was 140 mM NaCle, pH 7.4en=10 cells. (D) Corresponding reversal voltage (Erev) for each internal condition (upper), and comparison of photocurrent amplitudes at 0 mV for different internal cations (bottom). Square-block bar graph indicates Erev or amplitude from peak photocurrent (I1), open bar graphs indicate Erev or amplitude from steady-state photocurrent (I2). The pipette solution was 110 mM NMG-Cli, pH 7.4i, the bath solution was 140 mM NMG-Cle, pH 7.4e (black), 140 mM NMG-Cle, pH 6.0e (red), 140 mM NaCle, pH 7.4e (blue) or 140 mM KCle, pH 7.4e (yellow). n=5–10 cells. (*p<0.05, **p<0.01). (E) Representative responses of a V2HeR3-expressing neuron to 10 ms light pulses (left, λ=505 nm, 24.5 mW/mm2) at 1 Hz. (F) The firstaction potential in E. the X axis is expanded. (G) Comparison of spike probability by electrical stimulation (right, 300 pA current injections) or light stimulation (left, λ=505 nm, 24.5 mW/mm2). The Square-block bar indicates spike probability from V2HeR3-expressing neurons, the open bar indicates spike probability from the neurons without V2HeR3. n=6–11 cells.

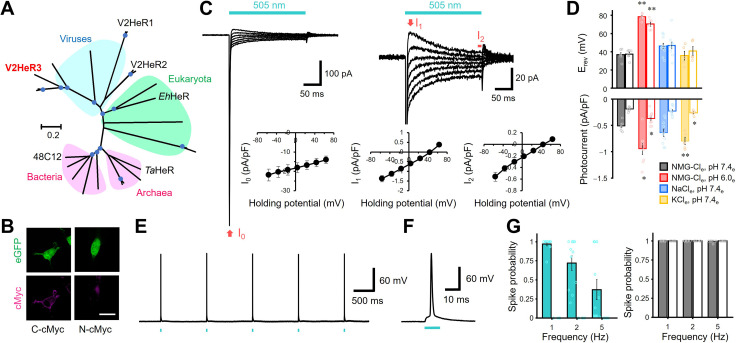
Figure 1.

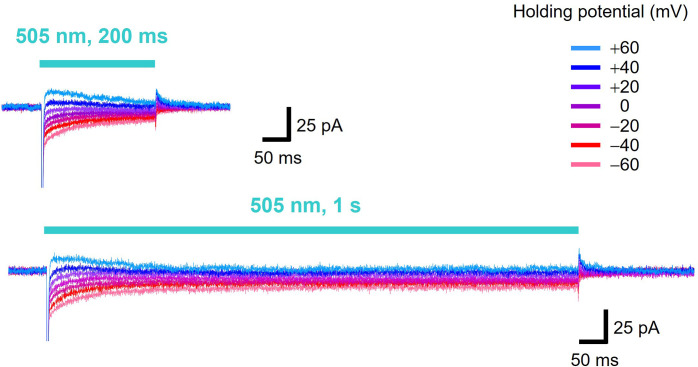
Figure 1—figure supplement 1. Photocurrents of viral HeR from Emiliania huxleyi virus 202 (V2HeR3) under different illumination periods.

Figure 1—figure supplement 1.

Electrophysiological measurements of V2HeR3-driven photocurrent in ND7/23 cells. The cells were illuminated with light (λ=505 nm, 24.5 mW/mm2) during the time region shown by blue bars. The membrane voltage was clamped from −60 to +60 mV for every 20 mV step. The pipette solution was 110 mM NaCli, pH 7.4i, the bath solution was 140 mM NaCle, pH 7.4e.

Figure 1—figure supplement 2. Photocurrents of viral HeR from Emiliania huxleyi virus 202 (V2HeR3) under different light intensities.

Figure 1—figure supplement 2.

Photocurrent amplitude was plotted as a function of light power. Membrane voltage was clamped at −60 mV, 505 nm light were illuminated respectively. Half saturation maxima (EC50) of the transient photocurrent (I0; left), peak photocurrent (I1; middle), and steady-state photocurrent (I2; right) are 13±2.2 mW/mm2 (± SEM), 0.48±0.017 and 0.18±0.016 mW/mm2, respectively. The pipette solution was 110 mM NMG-Cli, pH 7.4i, the bath solution was 140 mM NaCle, pH 7.4e. n=5–8 cells.

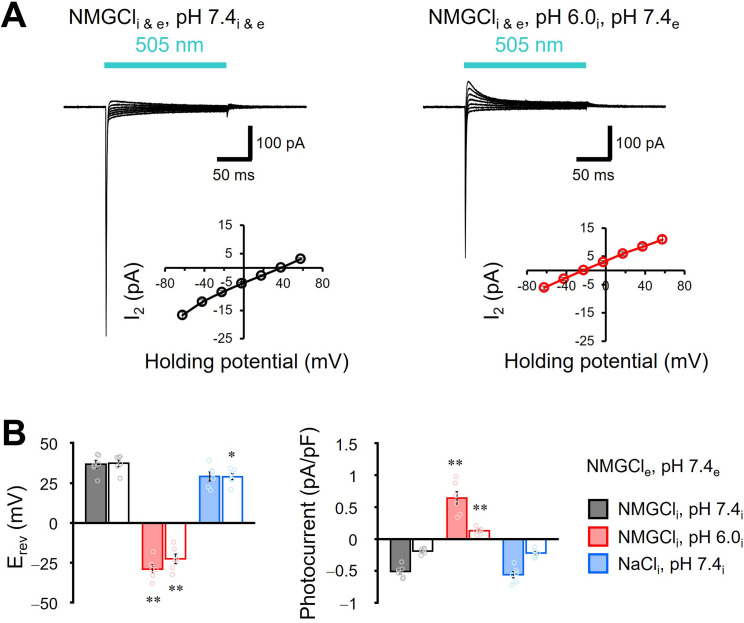
Figure 1—figure supplement 3. Selectivity of cations in the transport of viral HeR from Emiliania huxleyi virus 202 (V2HeR3).

Figure 1—figure supplement 3.

(A) Representative photocurrent trace of V2HeR3 recorded in ND7/23 cells. The cells were illuminated with light (λ=505 nm, 24.5 mW/mm2) during the time region shown by blue bars. Voltage was clamped from −60 to +60 mV in 20 mV steps. The bath solution was 140 mM NMG-Cle, pH 7.4e. The pipette solution was 110 mM NMG-Cli, pH 7.4i (left). The pipette solution was 110 mM NMG-Cli, pH 6.0i (right). n=6 cells. (B) Corresponding reversal potential (Erev) for each internal condition (left), and comparison of photocurrent density at 0 mV for different internal cations (right). Square-block bars indicate Erev or amplitude from I1, open bars indicate Erev or amplitude from steady-state photocurrent (I2). n=6 cells. (*p<0.05, **p<0.01).

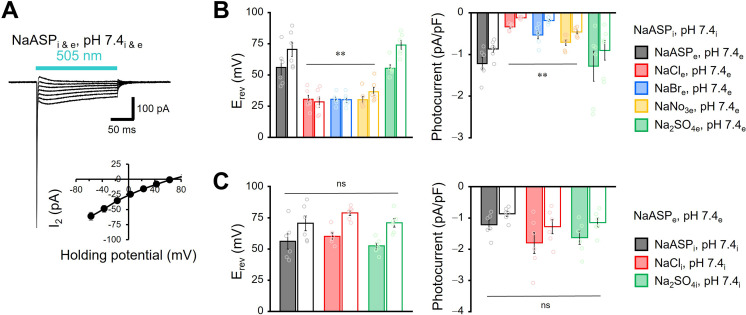
Figure 1—figure supplement 4. Effect of anions in the transport of viral HeR from Emiliania huxleyi virus 202 (V2HeR3).

Figure 1—figure supplement 4.

(A) Representative photocurrent trace of V2HeR3 recorded in ND7/23 cells. The cells were illuminated with light (λ=505 nm, 24.5 mW/mm2) during the time indicated by a blue bar. Voltage was clamped from −60 to +60 mV in 20 mV steps. The pipette solution was 110 mM NaASPi, pH 7.4i, the bath solution was 140 mM NaASPe, pH 7.4e. n=6 cells. Inset, I-V plot of steady-state current (I2). (B) and (C) Reversal potential (Erev) for each external (B) or internal (C) condition (left), and comparison of photocurrent density at 0 mV for different external (B) or internal (C) anions (right). Square-block bar graphs indicate Erev or amplitude from peak photocurrent (I1), open bar graphs indicate Erev or amplitude from steady-state photocurrent (I2). n=6 cells. (**p<0.01).

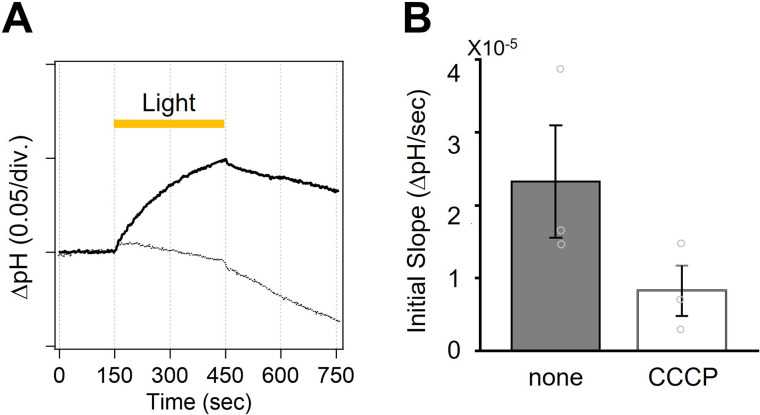
Figure 1—figure supplement 5. Ion transport activity of viral HeR from Emiliania huxleyi virus 202 (V2HeR3) in Pichia pastoris measured by a pH-electrode.

Figure 1—figure supplement 5.

(A) Ion pump activity of P. pastoris cell suspensions (100 mM NaCl) expressing V2HeR3-WT without (solid line) and with (dotted line) CCCP. (B) Initial slope in light-induced pH changes. n=3.

Figure 1—figure supplement 6. Effect of anions in the I0 component of viral HeR from Emiliania huxleyi virus 202 (V2HeR3).

Figure 1—figure supplement 6.

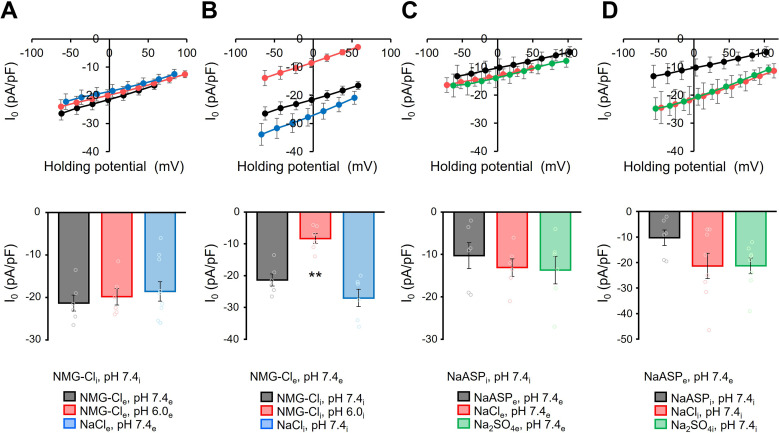
(AD) Upper: I-V relationship of the photocurrent (I0) under various ionic conditions. (A) The pipette solution contained 110 mM NMG-Cl at pH 7.4i, while the bath solution was varied as shown below the graph. (B) The bath solution contained 140 mM NMG-Cl at pH 7.4e, while the pipette solution was varied as shown below. (C) The pipette solution contained 110 mM NaASP, pH 7.4i, while the bath solution was varied as shown below. (D) The bath solution contained 140 mM NaASP, pH 7.4e, while the pipette solution was varied as shown below. n=6 cells. (AD) Lower: Photocurrent density at 0 mV for each external or internal condition. n=6–8 cells. (**p<0.01).

Figure 1—figure supplement 7. Kinetics properties of the I0 component.

Figure 1—figure supplement 7.

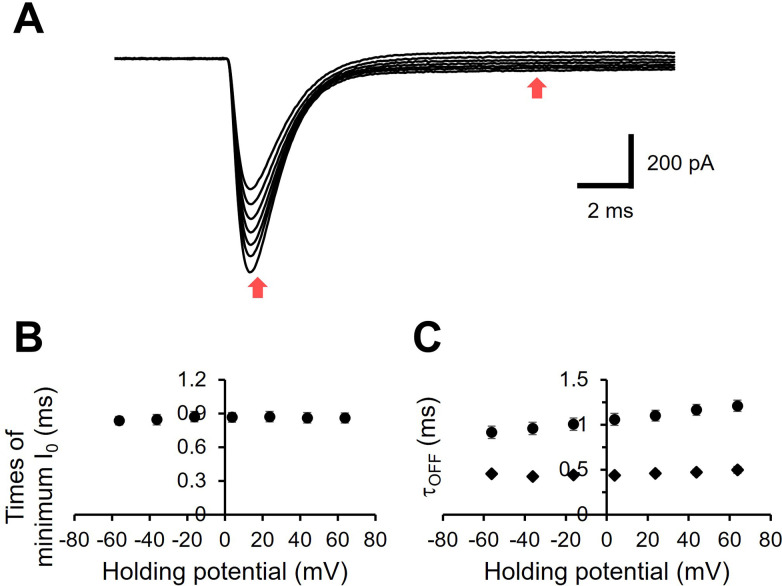
(A) The same photocurrent traces as Figure 1C. The X axis is expanded. (B) Time of the negative-going peak was plotted as a function of membrane voltage. (C) The voltage dependency of the time constants. Exponential fitting was performed to determine the time constant of I0 relaxation. The fitting was made between the time points indicated by two red arrows in panel A. Two time constants were obtained from each current trace.

Figure 1—figure supplement 8. Light power dependency of neuronal manipulation by viral HeR from Emiliania huxleyi virus 202 (V2HeR3).

Figure 1—figure supplement 8.

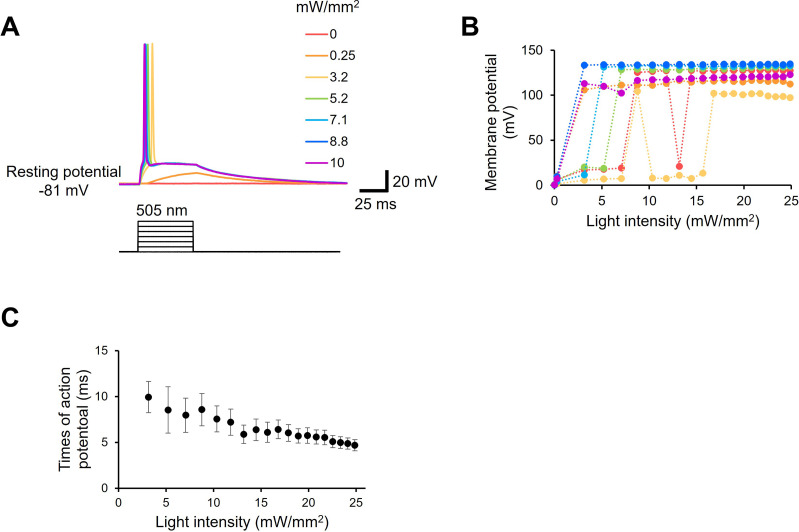
(A) Representative action potentials evoked by various light power. 505 nm light was applied to neurons for 50 ms as indicated by black bars. (B) Evoked action potentials from seven neurons were plotted as a function of light power. (C) Time of the peak potential was fitted as a function of the light power.