. 2022 Sep 6;11:e78416. doi: 10.7554/eLife.78416

Figure 2. Molecular properties of the purified viral HeR from Emiliania huxleyi virus 202 (V2HeR3) proteins expressed in Pichia pastoris cells.

(A) UV-visible absorption spectrum of V2HeR3 in detergent (0.1% n-dodecyl-β-D-maltoside [DDM]). (B) Time evolutions of transient absorption changes at characteristic wavelengths of specific photointermediates of V2HeR3. (C) Photocycle of V2HeR3 determined by analyzing the time evolution with multiexponential functions. (D) Light-induced low-temperature K-minus-dark (top) and M-minus-dark (bottom) difference UV-visible spectra of V2HeR3 obtained at 100 and 230K, respectively. Black curves represent the formation of the K and M intermediates by illuminating at 500 and>490nm, respectively, while red curves represent the reversion from the intermediates by illuminating at>530 and 400nm, respectively. (E) Light-induced low-temperature K-minus-dark (top) and M-minus-dark (bottom) difference FTIR spectra of V2HeR3 obtained at 100 and 230K, respectively, in the 1250–1150 cm–1 region. (F) Light-induced low-temperature K-minus-dark (top) and M-minus-dark (bottom) difference FTIR spectra of V2HeR3 in H2O (black) and D2O (red) obtained at 100 and 230K, respectively, in the 1780–1600 cm–1 region.

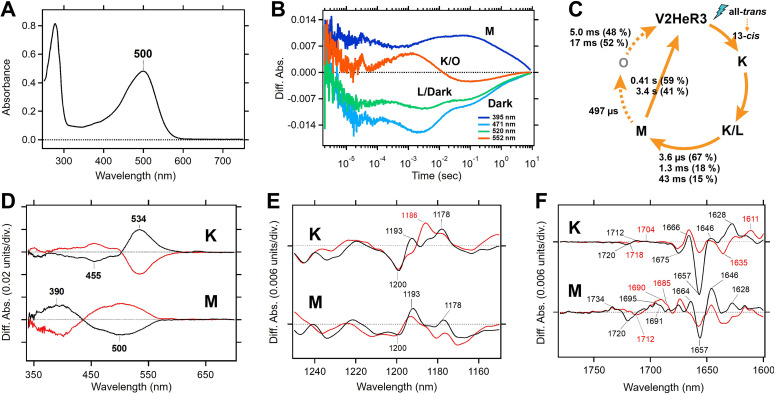
Figure 2.

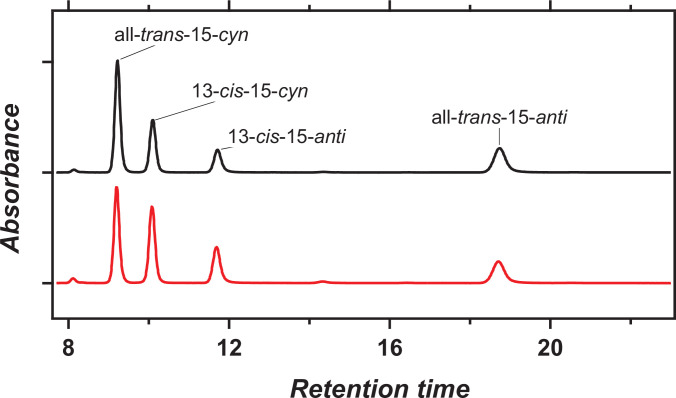
Figure 2—figure supplement 1. HPLC pattern of the retinal chromophore in viral HeR from Emiliania huxleyi virus 202 (V2HeR3).

Figure 2—figure supplement 1.

HPLC pattern of retinal extracted from V2HeR3 in the dark (black) and during light illumination at λ=500 ± 10nm (red). The populations of the all-trans and 13-cis forms are 64% and 36% in the dark, and 51% and 49% in the light, respectively.

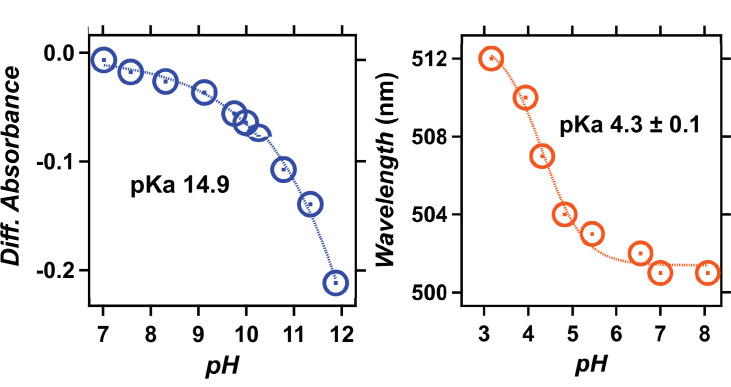
Figure 2—figure supplement 2. pH titration of viral HeR from Emiliania huxleyi virus 202 (V2HeR3).

Figure 2—figure supplement 2.

UV-visible absorption spectra (left) and the λmax (right, orange solid circles) of heliorhodopsin 48C12 at pH 2.8–8.4. When pH is lowered, a red-shift of the absorption is observed, which is commonly reported for many type-1 rhodopsins and reflects protonation of counterions. Thus, the red-shift of heliorhodopsin 48C12 originates from protonation of E107, which is fitted with the Henderson–Hasselbalch equation (blue dashed line), and the pKa of counterion (E107) is estimated to be 3.7. At pH<2.8, a large blue shift to 443nm is observed, presumably owing to the acid denaturation of the protein.

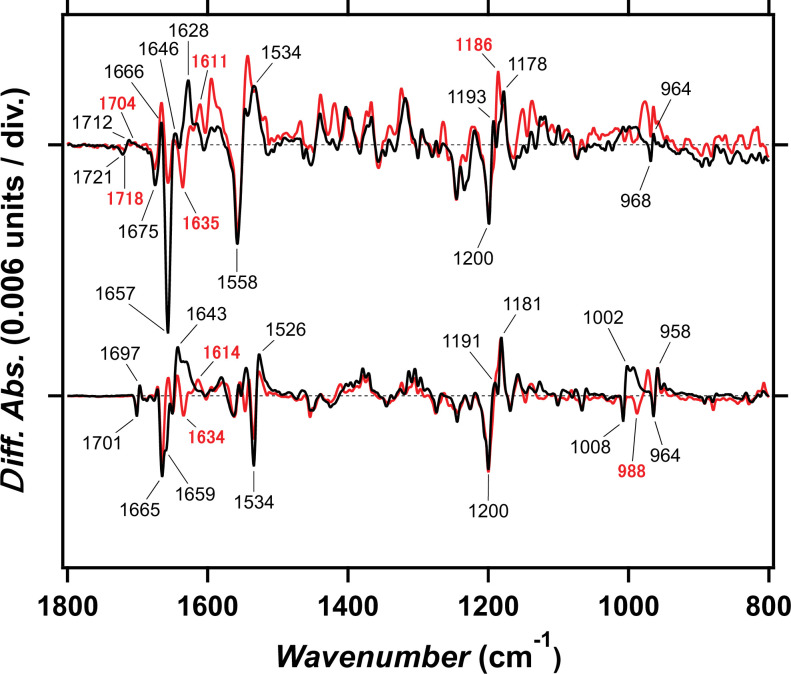
Figure 2—figure supplement 3. Light-induced difference FTIR spectra of viral HeR from Emiliania huxleyi virus 202 (V2HeR3) and TaHeR at 77K.

Figure 2—figure supplement 3.

Light-induced difference FTIR spectra of V2HeR3 (upper) and TaHeR (lower) in the 1800–800 cm–1 region at 100 and 77K, respectively. The spectra of TaHeR are reproduced from Shihoya et al., 2019. Positive and negative bands represent vibrations of the primary K intermediate and the unphotolyzed state, respectively, and characteristic vibrational bands are tagged. C=C stretch, C-C stretch, and hydrogen-out-of-plane (HOOP) vibrations of the retinal chromophore appear at 1550–1500, 1250–1100, and 1000–900 cm–1, respectively. These signals resemble between V2HeR3 and TaHeR, suggesting common structural changes such as all-trans to 13-cis isomerization with distorted chromophore. Amide-I vibration of peptide backbone and carboxylic C=O stretch appear at 1700–1600 and 1800–1700 cm–1, respectively. Intense band at 1657 (−)/1628 (+) cm–1 in V2HeR3 is a signature of larger changes in the secondary structure in V2HeR3 than that in TaHeR. Carboxylic C=O stretch vibrations appear only for V2HeR3 at 1721 (−)/1712 (+) cm–1, not for TaHeR.

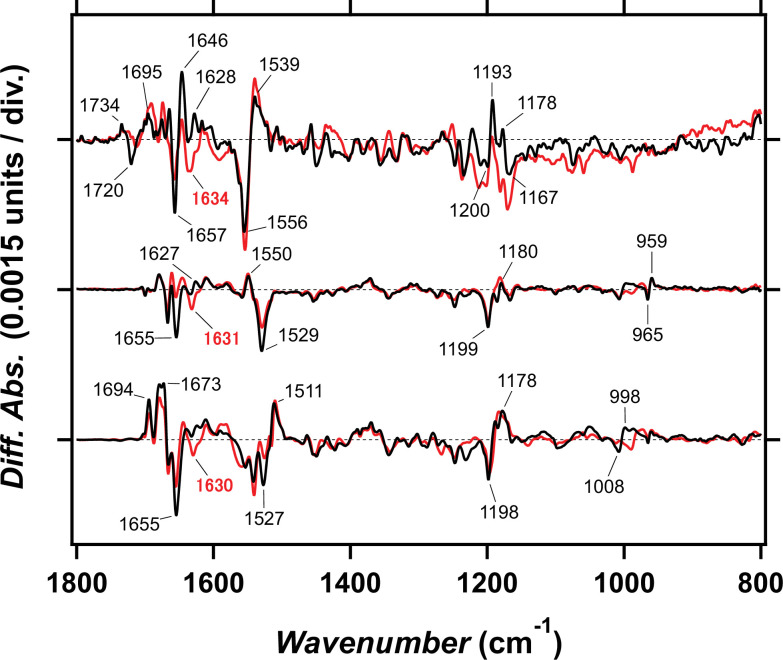
Figure 2—figure supplement 4. Light-induced difference FTIR spectra for late intermediates of viral HeR from Emiliania huxleyi virus 202 (V2HeR3) and TaHeR.

Figure 2—figure supplement 4.

Light-induced FTIR spectra of V2HeR3 at 230K (upper), TaHeR at 240K (middle), and TaHeR at 277K (lower) in the 1800–800 cm–1 region. The spectra of TaHeR are reproduced from Chen et al., 2000. While negative bands correspond to vibrations of the unphotolyzed state, positive bands of the upper, middle, and lower panels correspond to the M intermediate of V2HeR3, the M intermediate of TaHeR, and the O intermediate of TaHeR, respectively. Strong amide-I band, observed at 1657 (−)/1646 (+) cm–1 in V2HeR3 (upper), is similar to the case in the O intermediate of TaHeR (lower), not the M intermediate of TaHeR (middle).