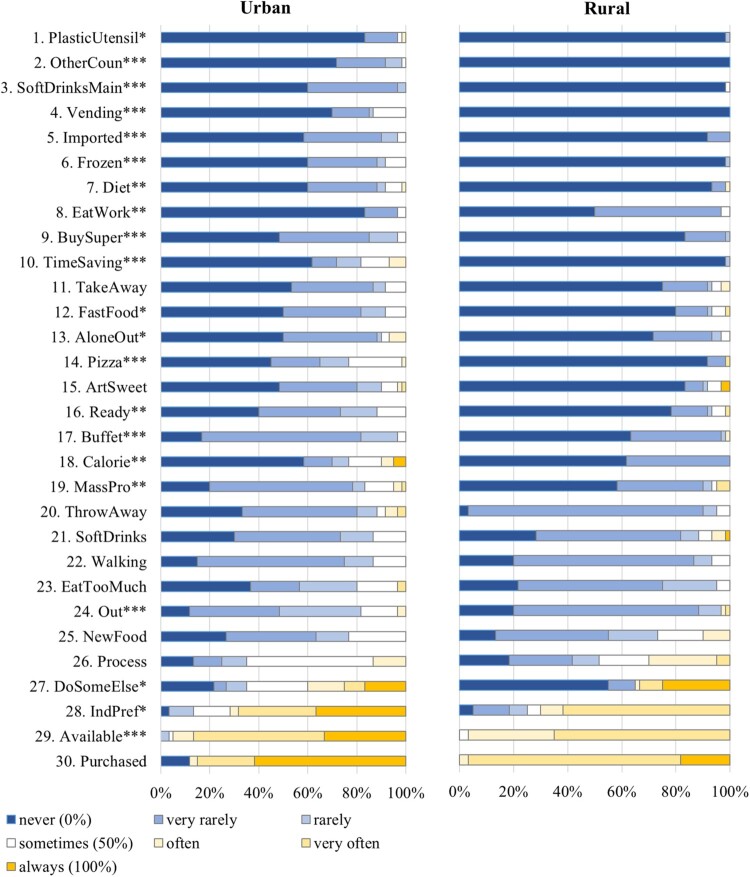
Figure 1.
Percentage of participants who responded to show the modern eating behaviors from never to always for the urban and rural samples (n = 120). Note. Items are sorted by their overall mean in ascending order. Full item names are displayed in Table 2. * p < .05; ** p < .01; *** p < .001.

