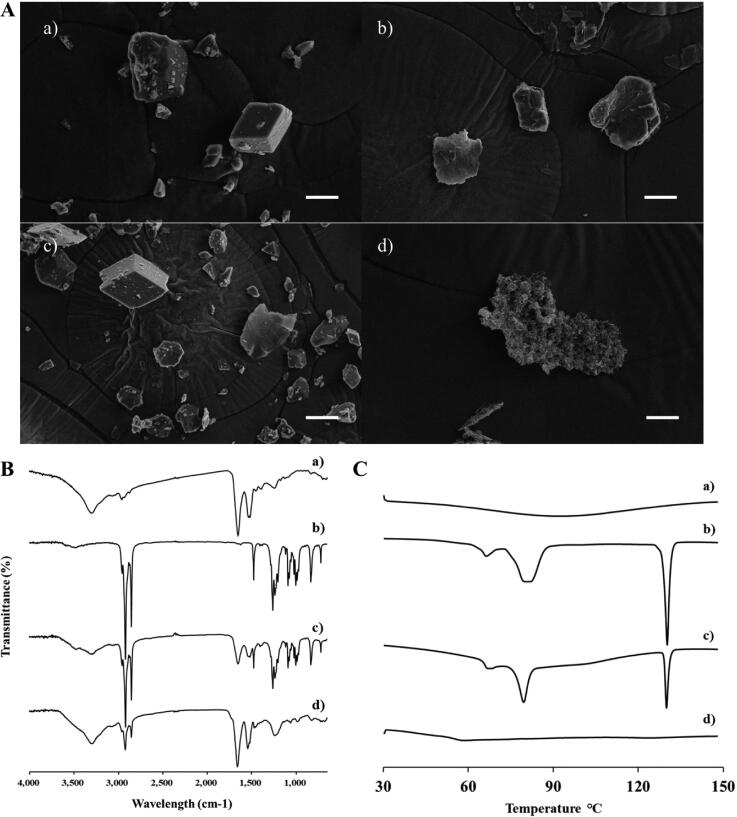
Figure 2.
Characterization of INS–SOS complex. A: Scanning electron microscopy; (B) Fourier transform infrared spectroscopy; (C) differential scanning calorimetry thermograms. (a) INS; (b) SOS; (c) physical mixture of INS and SOS; (d) INS–SOS. Scale bar = 5 μm. INS, insulin; SOS, sodium n-octadecyl sulfate.

