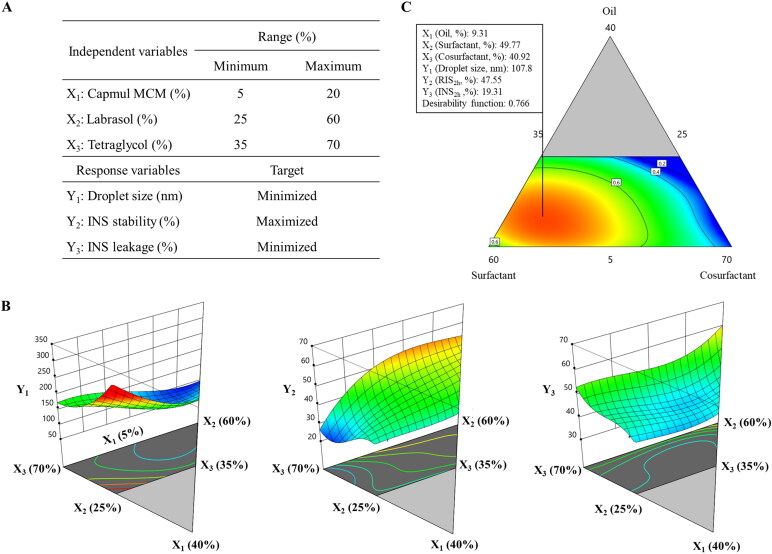
Figure 5.
Experimental design and mathematically analyzed plots. A: Independent and response variables used in the D-optimal mixture design. (B) Three-dimensional response surface plots of each response variable. (C) Overlay plot of the optimized self-microemulsifying drug delivery system formulation. Values in contour lines represent the desirability; X1: Capmul MCM, X2: Labrasol, X3: Tetraglycol, Y1: droplet size, Y2: INS stability, Y3: INS leakage. INS, insulin.

