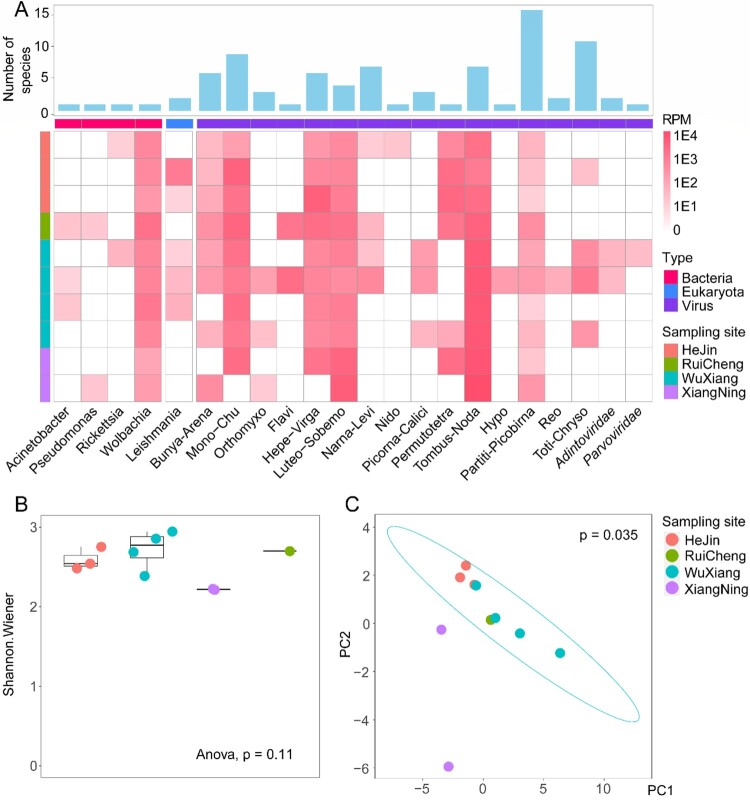
Figure 2.
Total microbiome characterization of sand flies. (A) The abundance and species richness of major types of microbes in sandflies revealed by meta-transcriptomic sequencing. The heatmap shows the microbial abundance (measured by RPM), and the bar chart shows the number of species associated with each taxon. (B) The comparisons of alpha-diversity across the four sampling locations. (C) Principal component analysis (applying the covariance matrix) for microbial composition across the four sampling locations.

