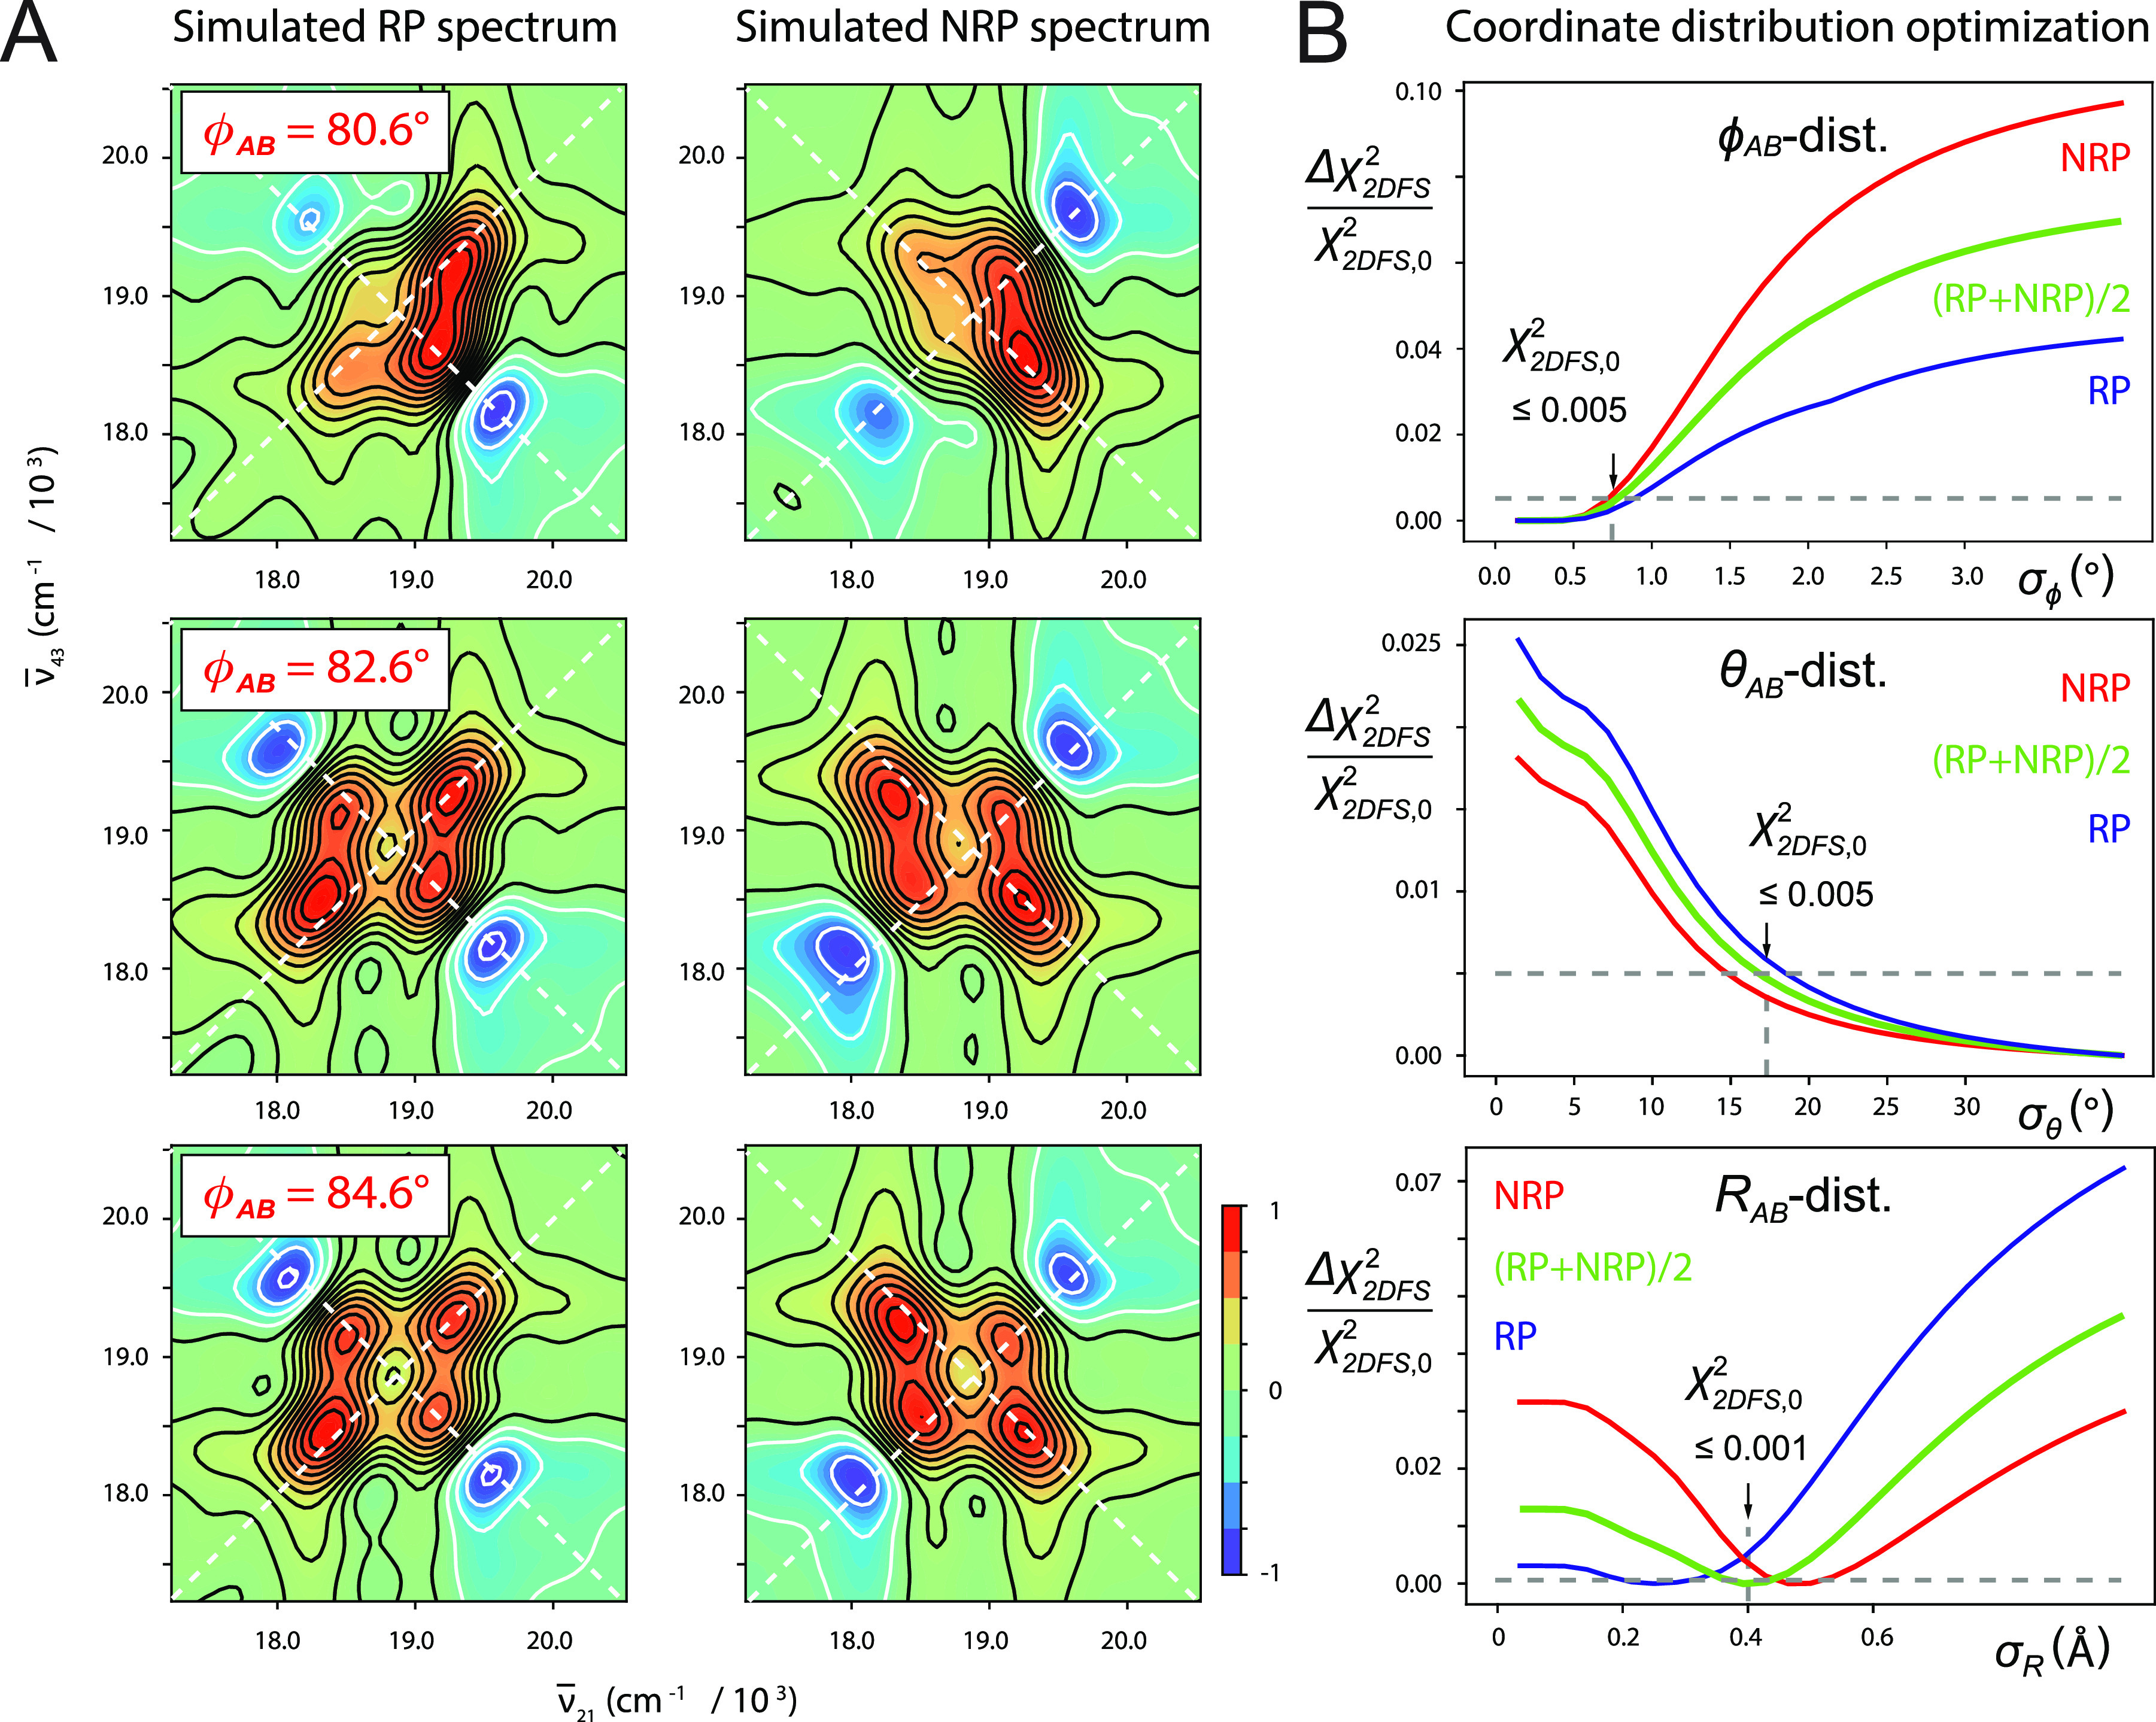
FIG. 3.

(a) Simulated RP and NRP “homogeneous” 2D fluorescence spectra (real part) of the +2 (iCy3)2 dimer ss–dsDNA construct for various values of the mean twist angle: = 80.6° (top row), 82.6° (middle), and 84.6° (bottom); mean tilt angle = 5.1°; mean separation = 2.8 Å; and homogeneous and inhomogeneous linewidth parameters ΓH = σI = 100 cm−1. (b) Cross sections of the relative deviation of the linear least squares error function, , are shown as functions of the standard deviations σϕ (top), σθ (middle), and σR (bottom). Inhomogeneously broadened spectra of the +2 (iCy3)2 dimer ss–dsDNA construct were simulated by numerically sampling the library of “homogeneous” 2D fluorescence spectra according to the Gaussian distribution of structural coordinates given in Eq. (21). Error function cross sections are shown plotted relative to their “optimized” values, (indicated by vertical arrows), which are defined as the 0.5% threshold for cases in which the function approached its minimum asymptotically (as do the σϕ and σθ cross sections) and the 0.1% threshold for cases in which the function exhibited a distinct minimum (as shown for the σR cross section).
