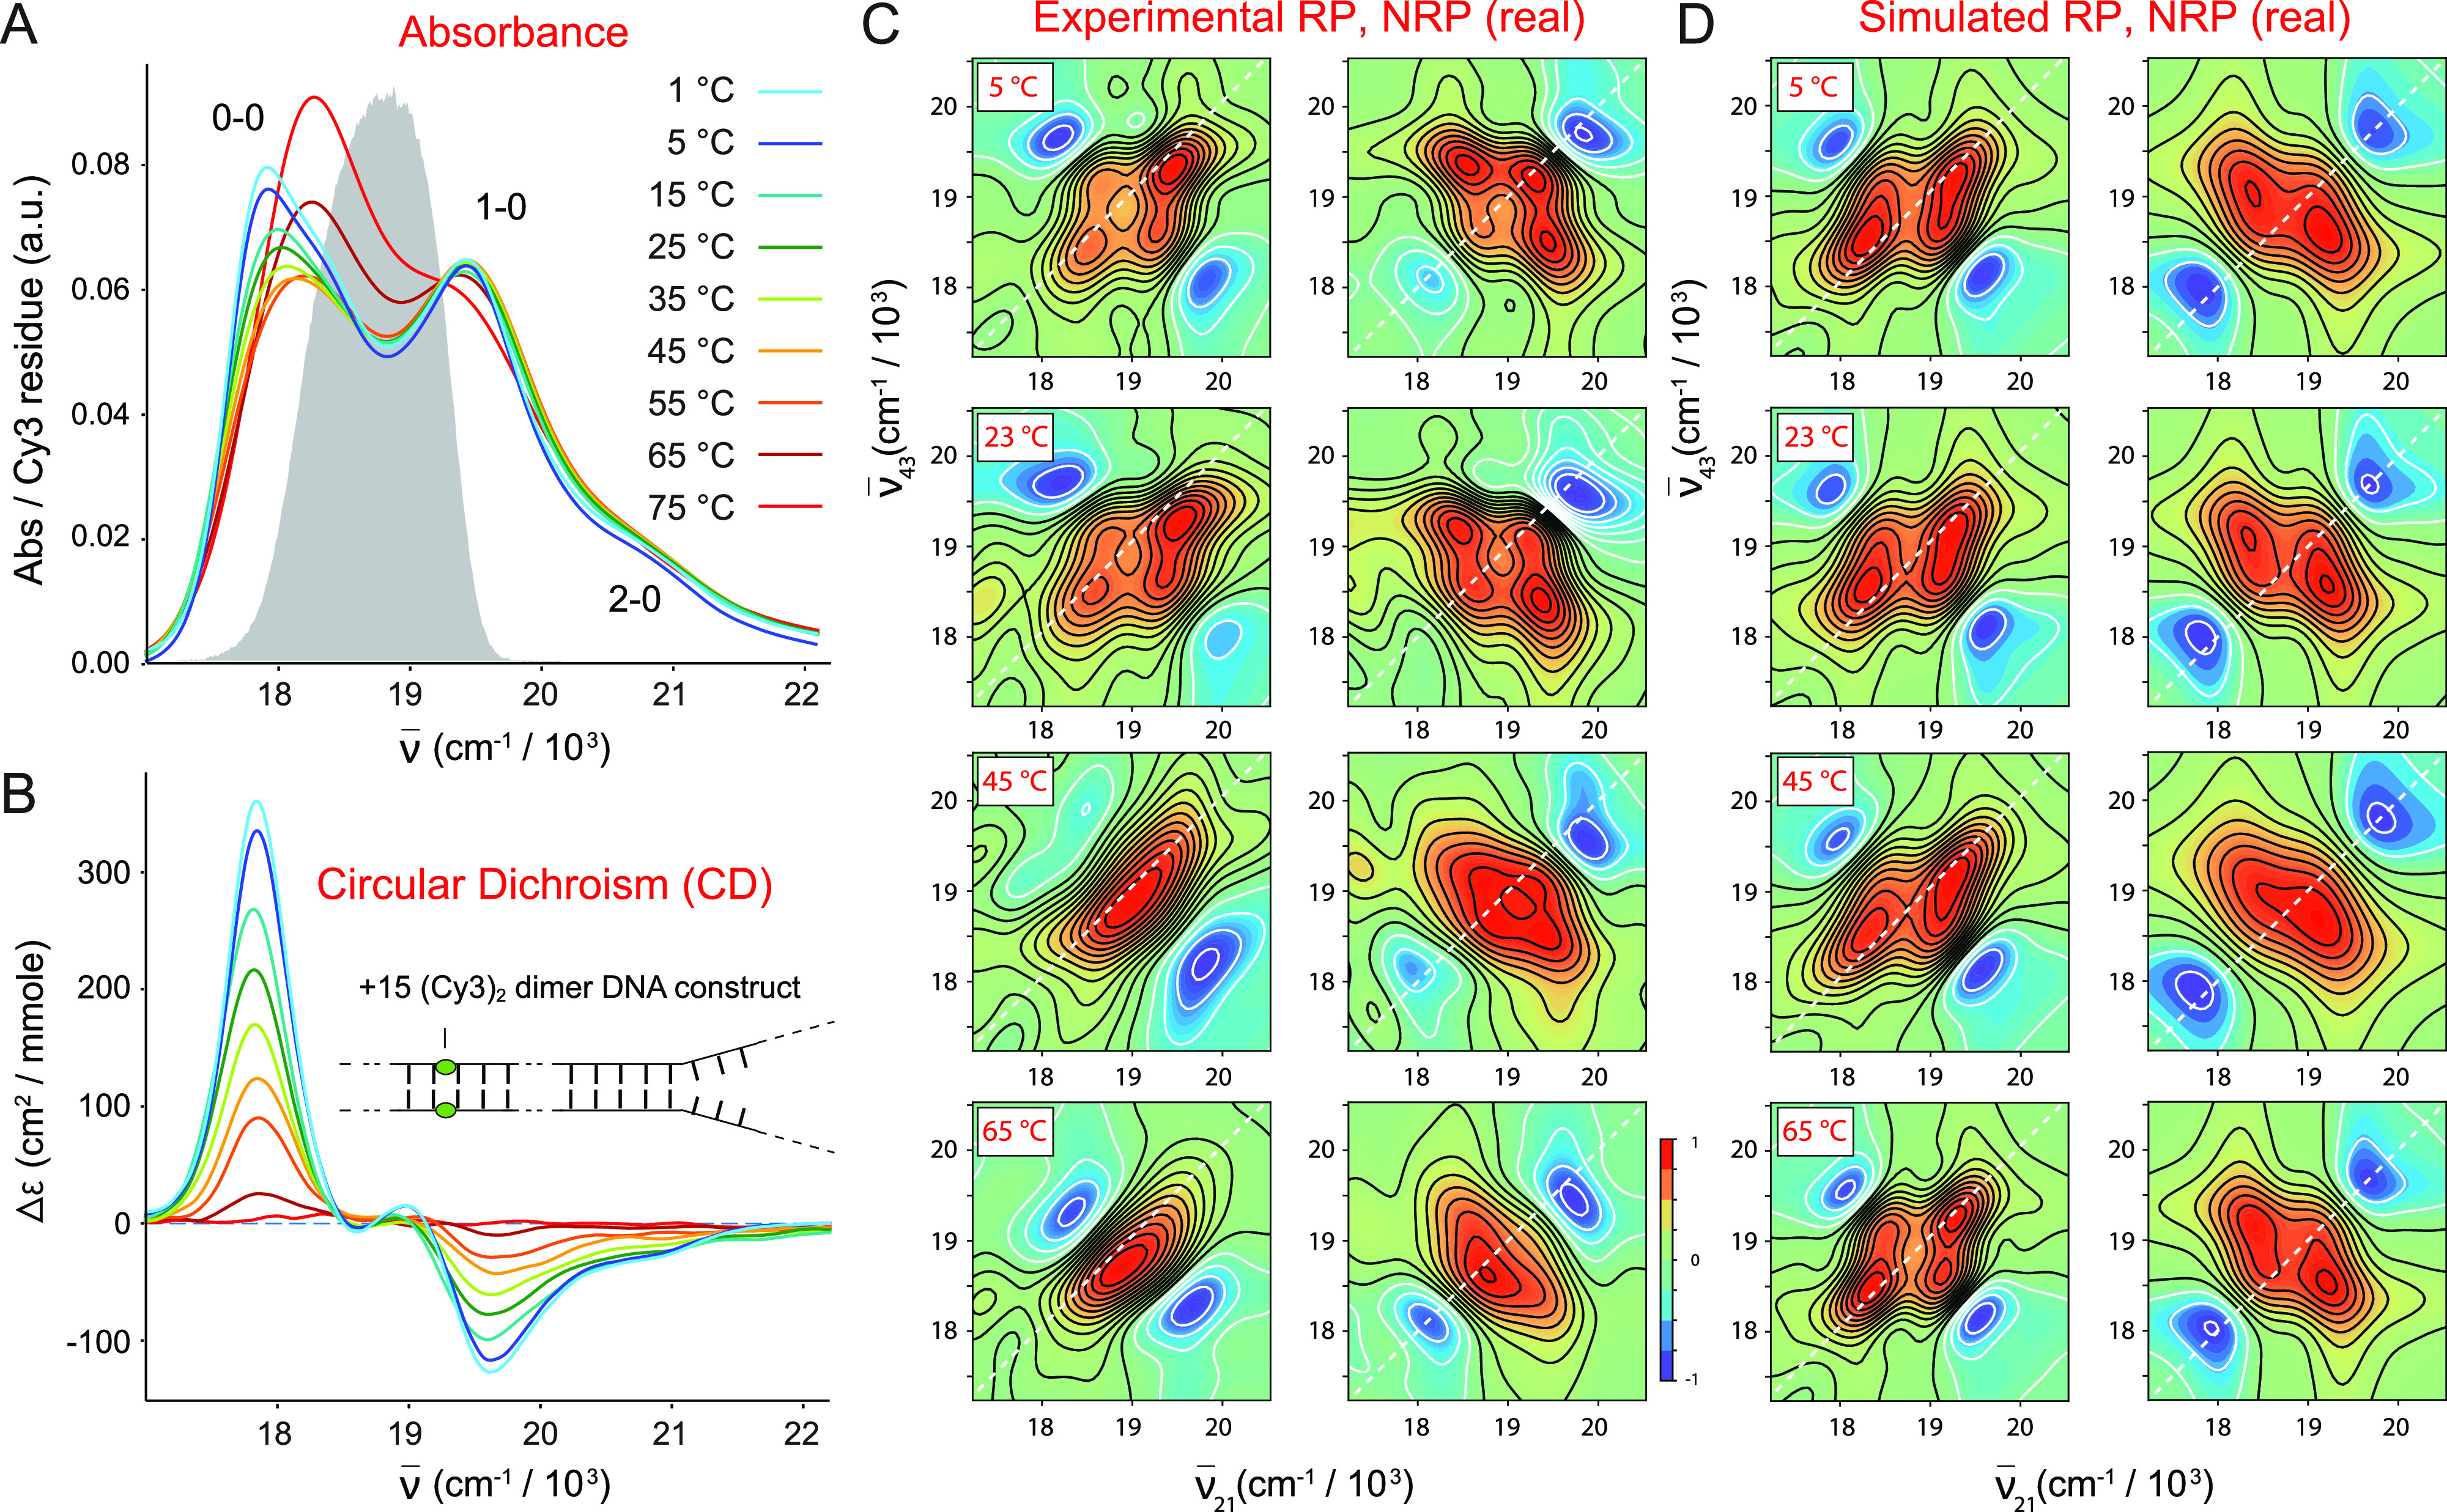
FIG. 5.

Temperature-dependent spectroscopic measurements of the (iCy3)2 dimer +15 ss–dsDNA construct. (a) Absorbance. (b) CD. (c) Experimental 2DFS. (d) Simulated 2DFS. The gray curve in (a) is the same laser spectrum, as shown in Fig. 4. In (c) and (d), both RP (left columns) and NRP (right columns) 2D spectra are shown. An additional comparison between the experimental 2DFS data and the optimized simulated spectra for the (iCy3)2 dimer +15 ss–dsDNA construct is presented in Figs. S6–S9 of the supplementary material.
