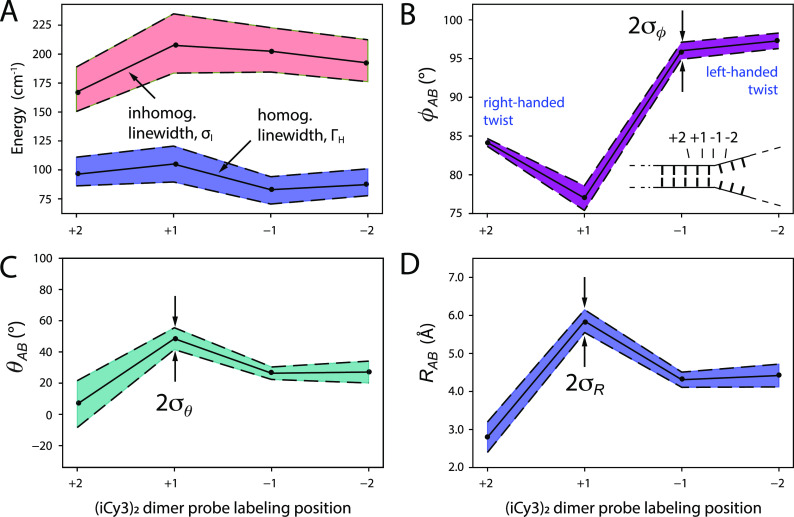
FIG. 8.
Optimized spectral linewidth and mean structural parameters of (iCy3)2 dimer-labeled ss–dsDNA constructs for varying label position obtained from 2DFS line shape analyses. (a) Homogeneous and inhomogeneous linewidth parameters. (b) Mean twist angle . (c) Mean tilt angle . (d) Mean inter-chromophore separation . In (a), the shaded regions bounded by the dashed lines indicate error bars, which were calculated based on a 1% deviation of the function [Eq. (20)] from its minimized value. In (b)–(d), the shaded regions bounded by the dashed lines indicate the standard deviations of the structural parameter distributions obtained from analyses of the 2DFS spectral line shapes, which are listed in Table V. These values were obtained by minimizing the least squares error functions shown in Fig. S23 of the supplementary material.

