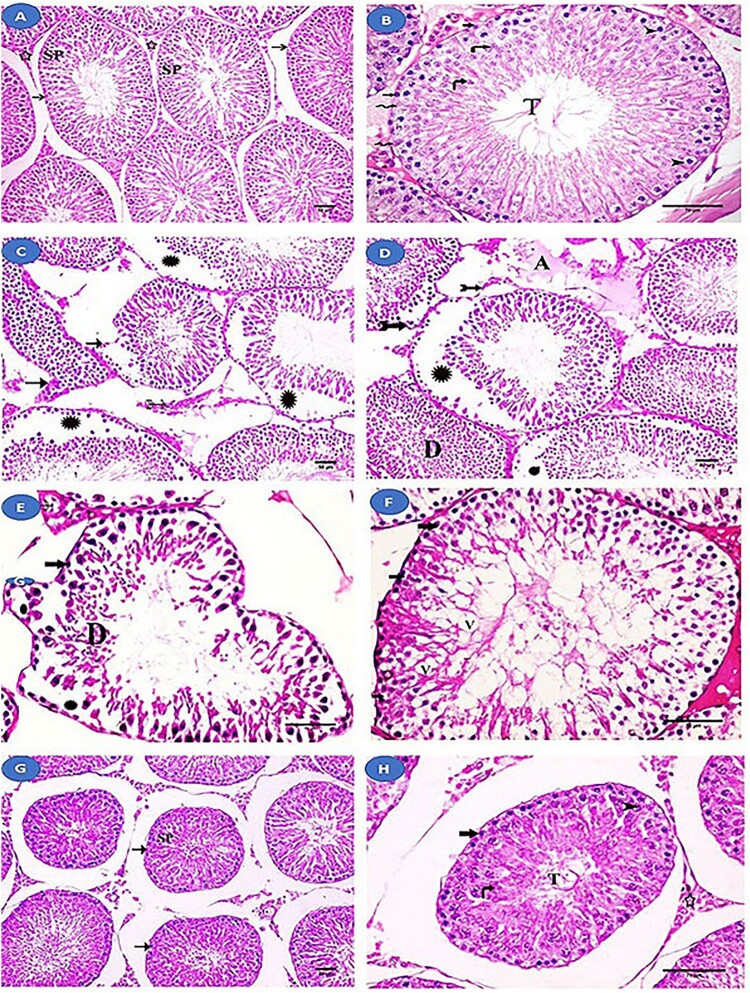
Figure 3.
Histological examination of the testis from the studied groups. (A, B) Normal control and fisetin groups with normal seminiferous tubules (→) lined with spermatogenic cells (SP) and Sertoli cells (zigzag arrow). Interstitial tissue (a star) between the tubules can be seen. The layers of spermatogenic cells are observed. Spermatogonia (thick arrow), primary spermatocyte (arrowhead), rounded spermatids (curved arrow), and sperm tail (T) can all be seen. (C-F) The MSG-treated group showing an abnormal increase in the spaces between the seminiferous tubules with irregular outlines (→) and focal separation of their basement membrane (bifid arrows). Wide intercellular spaces and separation (Asterix) between spermatogenic cells are observed. Homogenous acidophilic material (A) is observed between these tubules. There is an apparent decrease in the layers of spermatogenic cells and spermatogonia (thick arrow) with dark nuclei and vacuolated cytoplasm. Vacuoles (V) are seen between spermatogenic cells and desquamated cells (D) in the lumen. Leydig cells (feathered arrows) with dark nuclei and vacuolated cytoplasm. (G, H) fisetin + MSG group showing improvement in the architecture of the seminiferous tubules (→), with wide spaces between them and nearly normal spermatogenic cells (SP). Spermatogonia (thick arrow), primary spermatocyte (arrowhead), spermatid (curved arrow), sperm tail (T), and interstitial tissue (star) are nearly normal structure. Hematoxylin and eosin staining (A, C, D, G) (×200, scale bar = 50 µm) and (B, E, F & H) (×400, scale bar = 70 µm).

