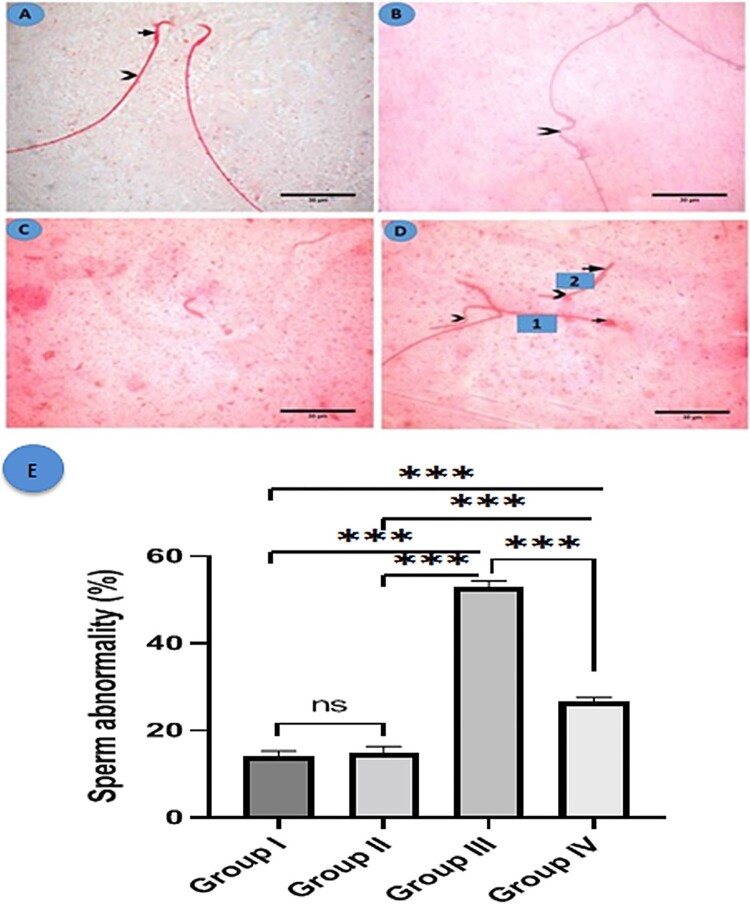
Figure 4.
Histological structure of sperm in the studied groups. Eosin Y (A) A photomicrograph of a normal sperm from the control group shows a normal head with a characteristic hook (arrow) and a regular long tail (arrowhead). (B-D) MSG group: (B) showing angulated tail (arrowhead), (C) showing a tailless head (absent tail), and (D) showing two sperms, sperm number (1) exhibits ballooned head (arrow) with a coiled short tail (arrowhead) while sperm number (2) shows hookless head (arrow) and a short tail (arrowhead) (×1000, scale bar = 30 µm). (E) Morphometric analysis of sperm abnormalities. All data are normally distributed and are expressed as mean and standard deviation. ns: non-significant, *p < 0.05, **p < 0.01, and ***p < 0.001.

