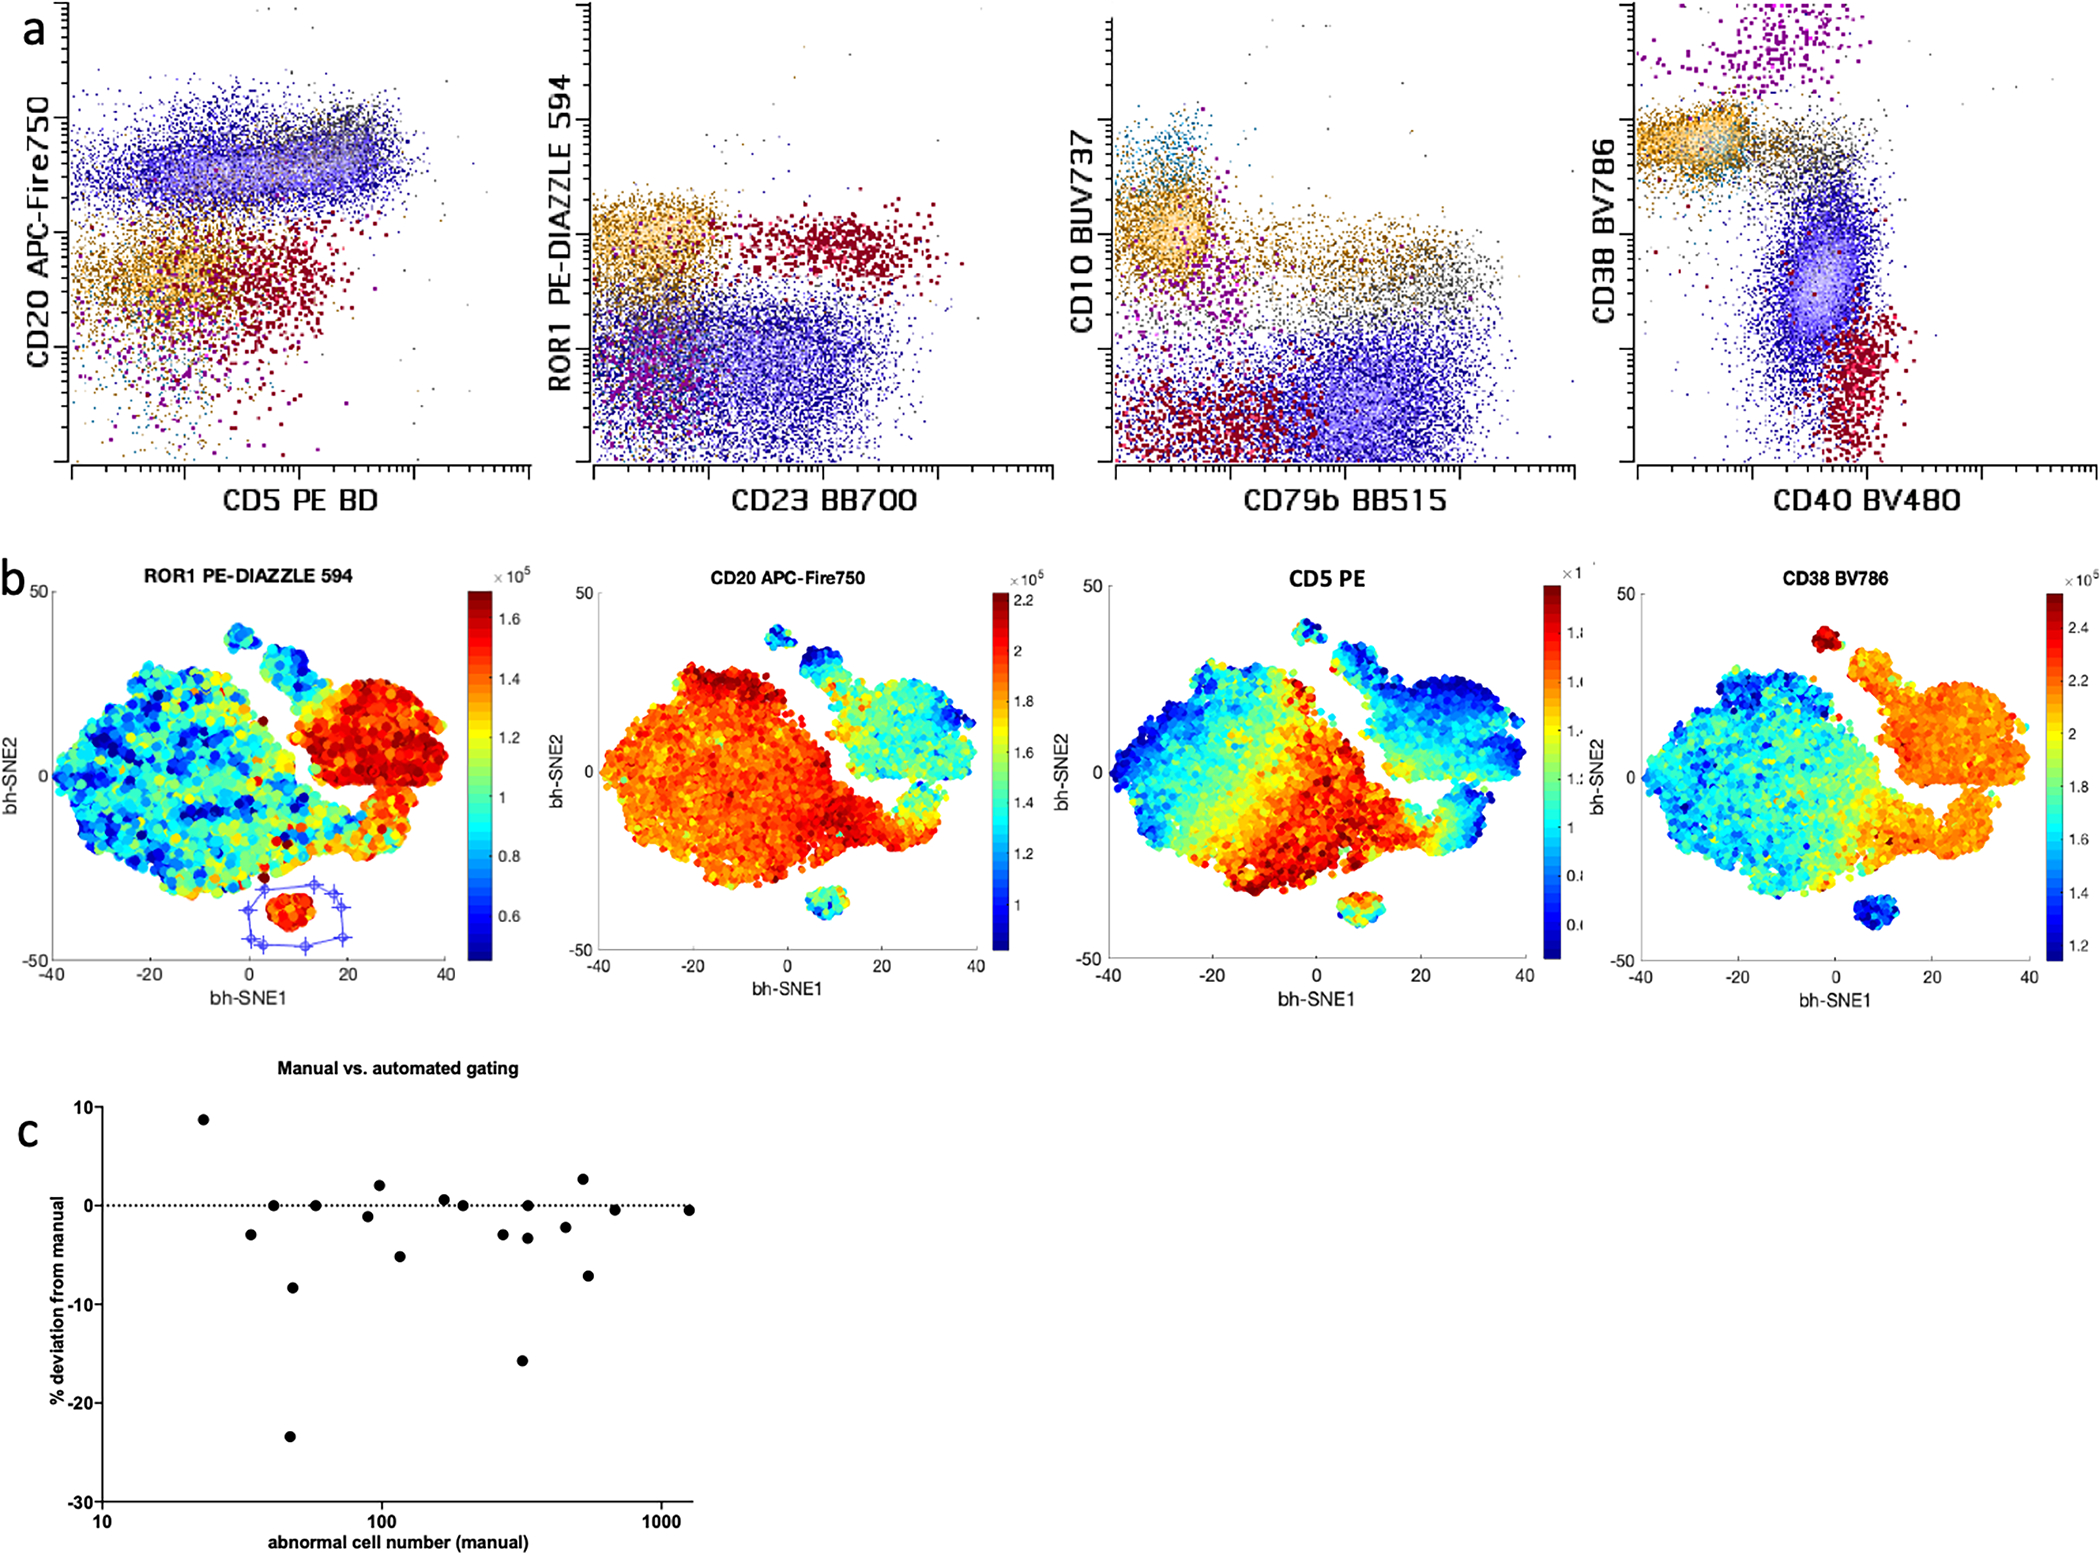
Figure 3:

Example of CLL gating on manual (a) vs. vi-SNE assisted analysis is shown (b). Same sample is represented. Only B cells and plasma cells (content of CD19 vs. side scatter gate) are shown. In the manual gate mature B cells are shown in dark blue, while early and intermediate B cells are shown in cyan and yellow respectively. Plasma cells are shown in violet. CLL population (emphasized) in MRD setting is shown in red. Note that gating CLL on manual analysis would require several sequential gates. vi-SNE plots (b) are colored by relative intensity of the marker as labeled at the top of the plot. Conversely CLL population (separate cluster gated on ROR1 plot) could be easily separated with objective gating on vi-SNE plot showing all B cells. Quantitation differences between expert manual and vi-SNE assisted gating of CLL in MRD setting ranging from (0.005–0.5%) is shown in panel c. Percent differences in cell quantitation are plotted. As expected, lower number of cells resulted in slightly higher disagreement between the methods.
