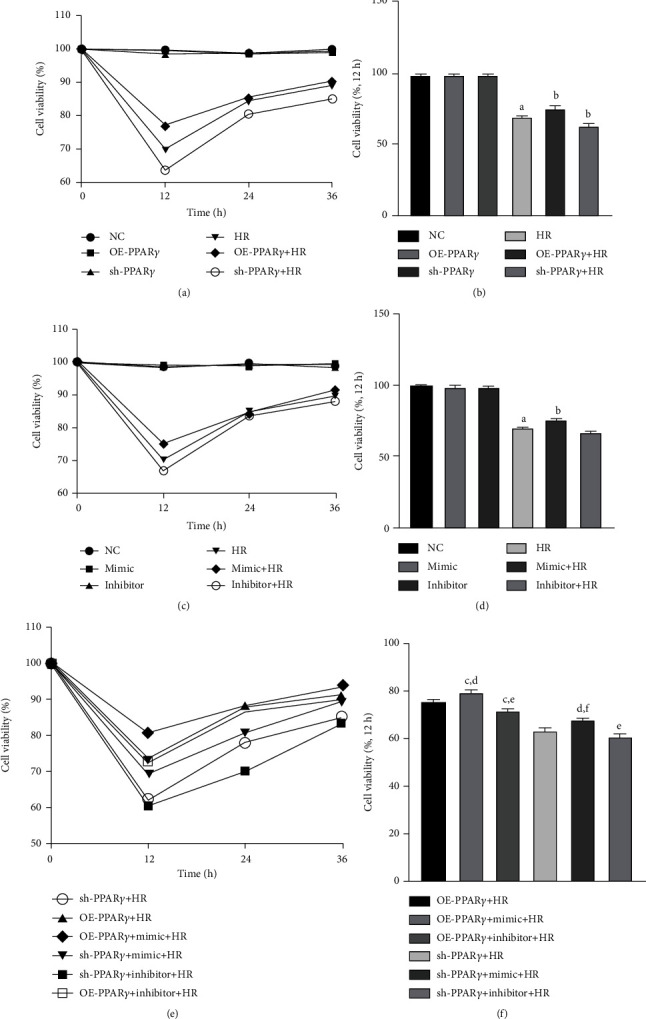
Figure 1.

Cell viability of each group, detected after 12 h reoxygenation: (a) cell viability of PPARγ regulation groups (n = 4); (b) column chart of PPARγ regulation groups; (c) cell viability of miR-21 regulation groups; (d) column chart of miR-21 regulation groups; (e) cell viability of the cotransfection groups; (f) column chart of the cotransfection groups (A represents values compared to the NC group, p < 0.05; B represents values compared to the HR group, p < 0.05; C represents values compared to the OE-PPARγ+HR group, p < 0.05; D represents values compared to the mimic+HR group, p < 0.05; E represents values compared to the inhibitor+HR group, p < 0.05; F represents values compared to the sh-PPARγ+HR group, p < 0.05).
