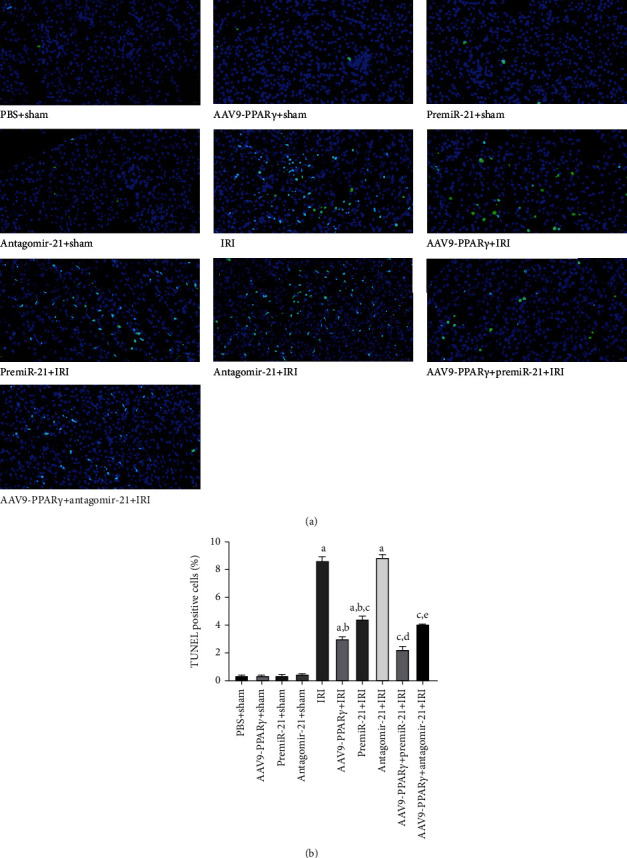
Figure 7.

TUNEL assay to evaluate the apoptosis of kidney tissues (n = 5): (a) representative photograph of TUNEL assay (scale bar 20 μm); (b) quantitative analysis of TUNEL assay in the kidneys (A represents values compared to the sham group, p < 0.05; B represents values compared to the IRI group, p < 0.05; C represents values compared to the AAV9-PPARγ+IRI group, p < 0.05; D represents values compared to the premiR-21+IRI group, p < 0.05; E represents values compared to the antagomiR-21+IRI group, p < 0.05).
