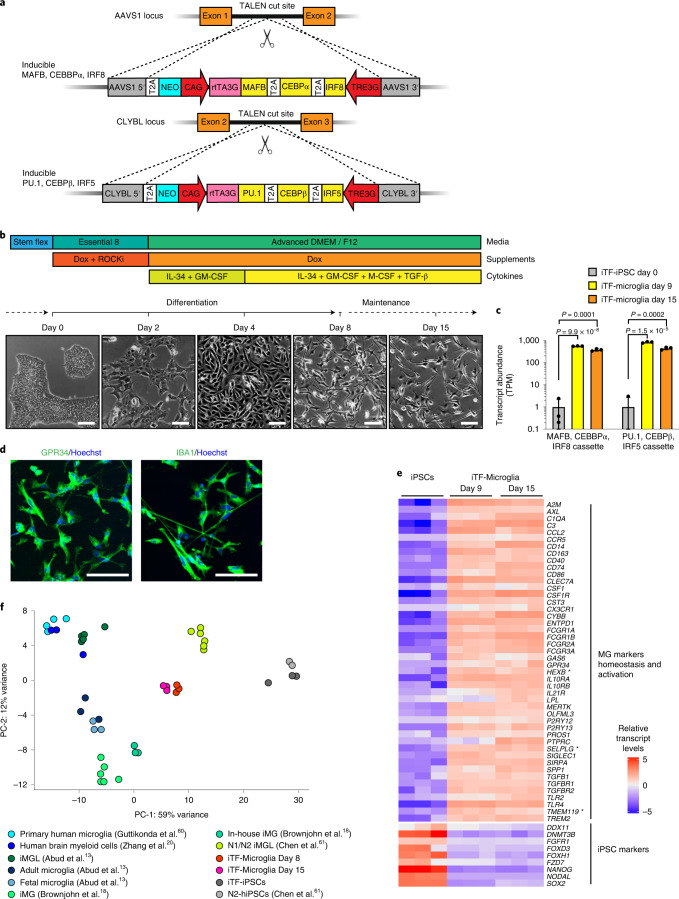
Fig. 1. Rapid differentiation of iPSCs into microglia-like cells (iTF-Microglia) by transcription factor induction.
a, Strategy for stable integration of six transcription factors in AAVS1 and CLYBL loci by TALEN-mediated integration: The doxycycline-inducible reverse transcriptional activator (rtTA3G) is driven by the constitutive CAG promoter. Human MAFB, CEBPα and IRF8 are driven by the tet response element (TRE3G) in the AAVS1 locus. Human PU.1, CEBPβ and IRF5 are driven by TRE3G in the CLYBL locus. All transcription factors are separated from each other via T2A ribosome skipping sequences. b, Overview of the differentiation process for generating iTF-Microglia. Top, timeline with media, cytokines and doxycycline (Dox); bottom, representative phase-contrast images of cells on the indicated days. Scale bar, 100 μm. c, Expression of six inducible transcription factors during iTF-Microglia differentiation. Transcript abundance (transcripts per million, TPM) of MAFB, CEBPα, IRF8 cassette and the PU.1, CEBPβ, IRF5 cassette at day 0, day 9 and day 15 of differentiation. Mean ± s.d., n = 3 biological replicates, P values from two-tailed Student’s t-test. d, Representative immunofluorescence micrographs of iTF-Microglia on day 8 of differentiation stained for microglia markers GPR34 and IBA1. Nuclei were labeled by Hoechst 33342. Scale bar, 100 μm. e, Expression of iPSC and microglia marker genes in iPSCs and derived iTF-Microglia on day 9 and day 15 of differentiation. The heatmap displays normalized and gene-centered TPM counts for selected genes (rows) for three biological replicates of timepoints (columns). iTF-Microglia express microglia homeostatic markers and activation markers, while losing their expression of iPSC markers. Asterisks highlight microglia-selective markers. f, Principal component analysis (PCA) on the expression of microglia marker genes of iTF-Microglia, human adult ex vivo microglia60, fetal and adult microglia13, human myeloid cells20, other iPSC-microglia (iMG) / iPSC-microglia-like cells (iMGL)13,18,61 and iPSCs (this study and ref. 61). Each dot reflects an independent biological sample. Colors represent the different cell types.

