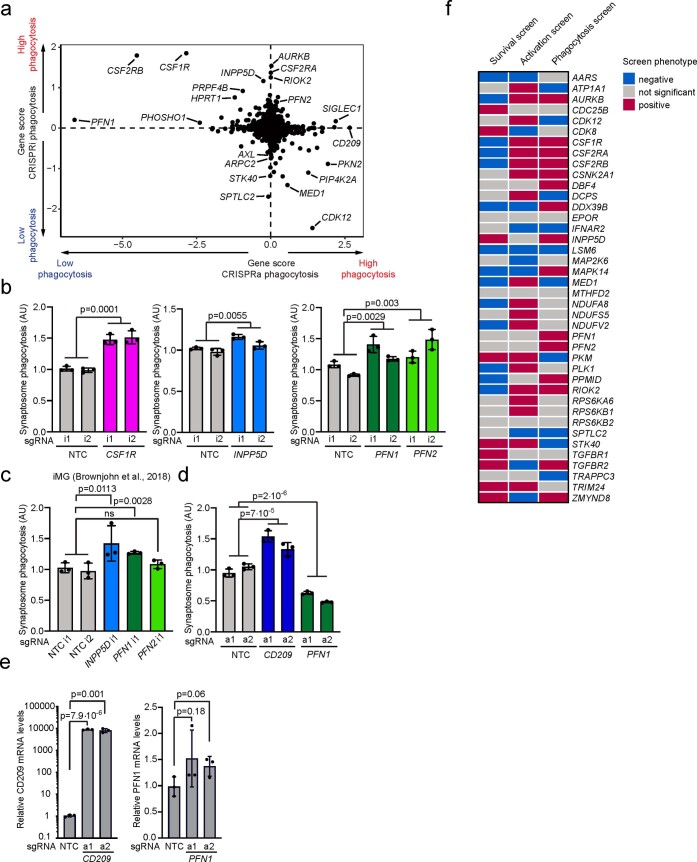
Extended Data Fig. 6. Validation of phagocytosis hits and overview of genes selected for the CROP-seq screen based on primary screens.
a, Comparing Gene Scores for hits from phagocytosis CRISPRi and CRISPRa screens. Each dot represents a gene. b-d, Validation of (b,c) CRISPRi hits and (d) CRISPRa hits in (b,d) iTF-Microglia or (c) iPSC-derived microglia differentiated using an alternative protocol by Brownjohn et al.18 Phagocytosis of pHrodo-labelled synaptosomes by cells expressing either non-targeting control (NTC) sgRNAs or sgRNAs targeting CSF1R, INPP5D, PFN1 and PFN2 was quantified by flow cytometry. Values represent mean + /− sd of n = 3 biological replicates; p values from two-tailed Student’s t-test. e, Overexpression of CD209 (left) and PFN1 (right) with the inducible CRISPRa system in iTF-Microglia. QPCR quantification of the relative fold change of CD209 and PFN1 mRNA levels in iTF-Microglia expressing CD209 and PFN1 sgRNA as compared to a non-targeting control sgRNA in the presence of TMP (mean + /− sd, n = 3 biological replicates; p values from two-tailed Student’s t-test). CD209 and PFN1 levels were normalized to the housekeeping gene GAPDH. f, Binary heatmap of genes selected for the CROP-seq screen and their knockdown phenotype in the CRISPRi survival, phagocytosis and inflammation screens. Red: KD increases phenotype (positive hit). Blue: KD decreases phenotype (negative hit). Grey: not a significant hit, p > 0.1.

