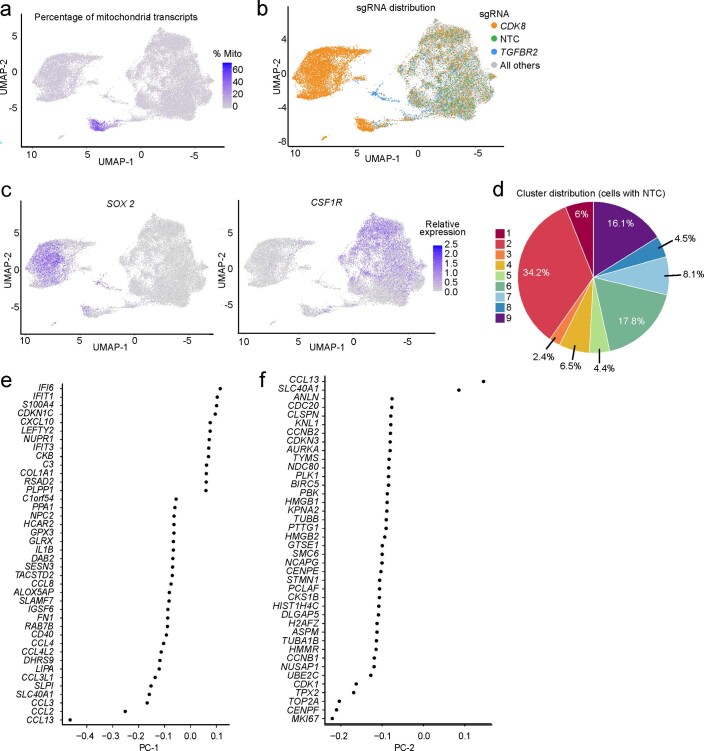
Extended Data Fig. 7. Characterization of microglia cluster signatures.
a-c, UMAP projection representing single-cell transcriptomes, with cells colored based on (a) the percentage of mitochondrial transcripts, (b) the expressed sgRNAs, with sgRNAs targeting CDK8 in orange, sgRNAs targeting TGFBR2 in blue, non-targeting control sgRNAs (NTC) in green, and all other sgRNAs in grey, or (c) expression levels of SOX2 (Left) or CSF1R (Right). d, Distribution of iTF-Microglia expressing non-targeting (NTC) sgRNAs across the 9 clusters described in Fig. 6. e, f,the top 40 genes with the highest embedding values for (e) the first principal component (PC-1) and (f) the second principal component (PC-2), displayed in ranking order.

