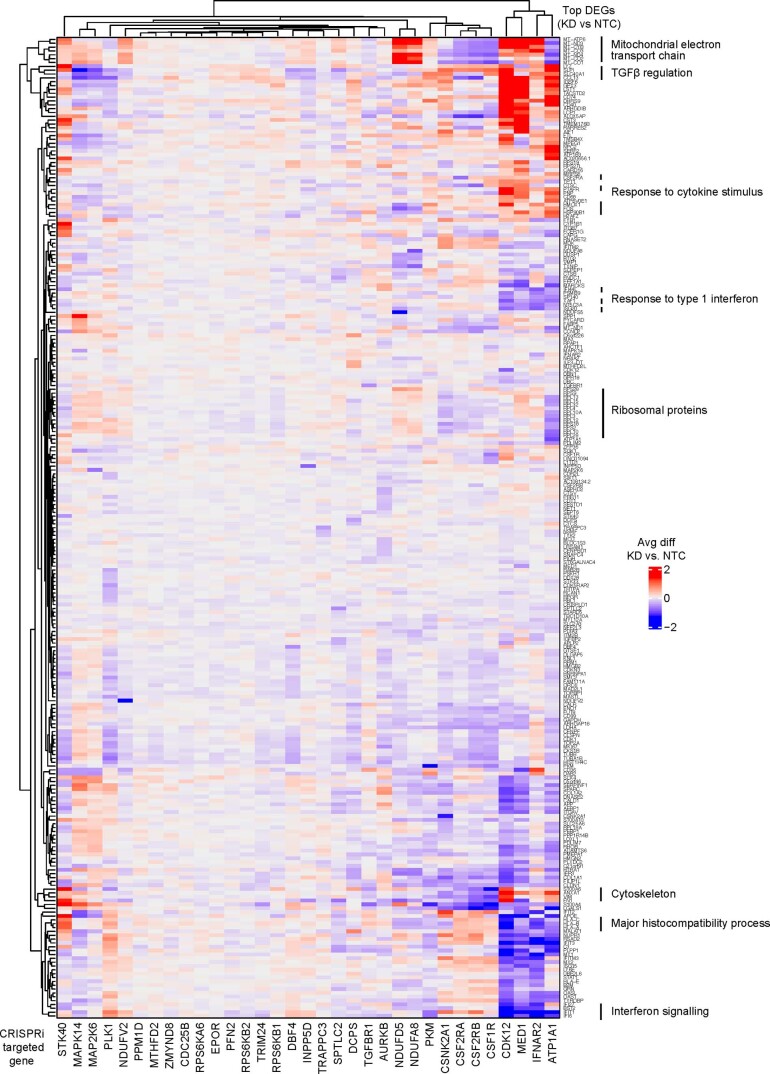
Extended Data Fig. 8. CROP-seq reveals transcriptomic changes in iTF-Microglia induced by gene knockdown.
Changes in gene expression in response to CRISPRi knockdown of genes of interest in iTF-Microglia. Each column represents one CRISPRi-targeted gene. For each CRISPRi-targeted gene, cells with the strongest knockdown were selected and the top 20 differentially expressed genes in comparison to non-targeting control (NTC) sgRNA containing cells were selected. The merged set of these genes is represented by the rows. Rows and columns were clustered hierarchically based on Pearson correlation. Functionally related clusters of differentially expressed genes are labeled.

