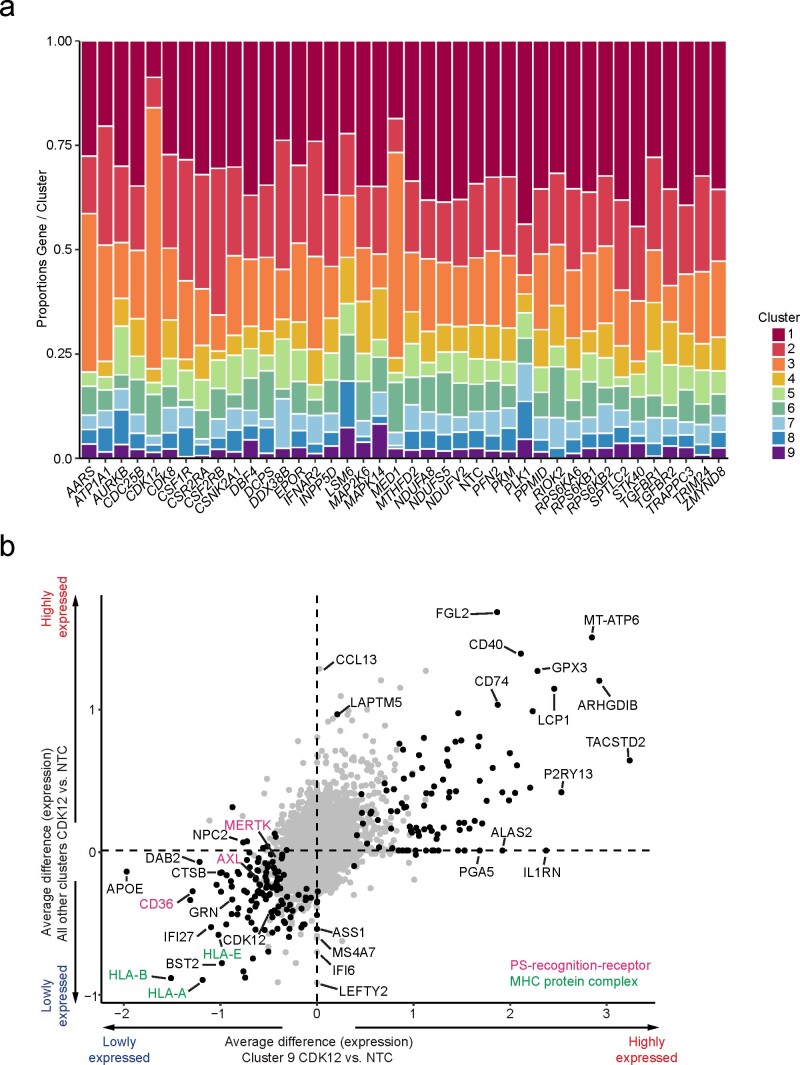
Extended Data Fig. 9. Transcriptomic changes in iTF-Microglia induced by CDK12 knockdown in cluster 9 and in all other clusters.
a, Changes in cluster distribution after CRISPRi knockdown of targeted genes in iTF-Microglia. Distribution of cells according to the 37 targeted genes and non-targeting control (NTC) in clusters 1–9. b, Average differences of gene expression induced by CDK12 knockdown in cluster 9 compared to those in all other clusters. Genes encoding phosphatidylserine (PS) recognition receptors are labeled in magenta and Genes encoding MHC complex components are labeled in green.

