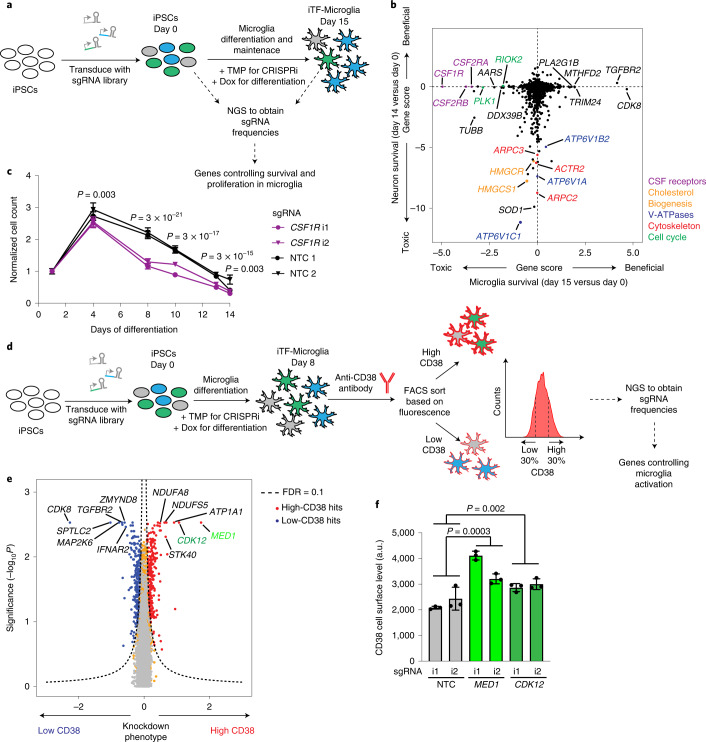
Fig. 4. Identification of modifiers of survival and inflammation by CRISPRi screens.
a, Strategy. b, Comparison of Gene Scores from CRISPRi survival screens in iTF-Microglia (this study) versus iPSC-derived neurons11. Each dot represents a gene; genes are color-coded by pathways. c, Validation of the phenotype of CSF1R knockdown. iTF-Microglia transduced with CSF1R-targeting or NTC sgRNAs were imaged on different days after differentiation, and live cells were quantified based on staining with Hoechst 33342. Data are shown as mean ± s.d., n = 3 wells per group; 7 fields were imaged for each well; P values from two-tailed Student’s t-test. d, Strategy for a CRISPRi screen to identify modifiers of the expression of CD38, a marker of reactive microglia. iPSCs expressing the inducible CRISPRi construct were transduced with the druggable genome sgRNA library. On day 0, doxycyline and cytokines were added to induce microglial differentiation, and TMP was added to induce CRISPRi activity. On day 8, iTF-Microglia were stained for cell-surface levels of CD38 and sorted by FACS into populations with low (bottom 30%) and high (top 30%) CD38 levels. Frequencies of iTF-Microglia expressing a given sgRNA were determined in each population by next-generation sequencing (NGS). e, Volcano plot indicating knockdown phenotype and statistical significance (two-sided Mann–Whitney U-test) for genes targeted in the CD38 level screen. Dashed line indicates the cut-off for hit genes (false discovery rate (FDR) = 0.1). Hit genes are shown in blue (knockdown decreases CD38 level) or red (knockdown increases CD38 level), nonhit genes are shown in orange and ‘quasi-genes’ generated from random samples of NTC sgRNAs are shown in gray. Hits of interest are labeled. f, Validation of the phenotype of MED1 and CDK12 knockdown. CD38 cell-surface levels measured by flow cytometry of day 8 iTF-Microglia targeting MED1, CDK12 compared with NTC sgRNA. Means ± s.d., n = 3 biological replicates; P values from two-tailed Student’s t-test. i1, i2 refer to independent CRISPRi sgRNAs targeting the indicated genes.

