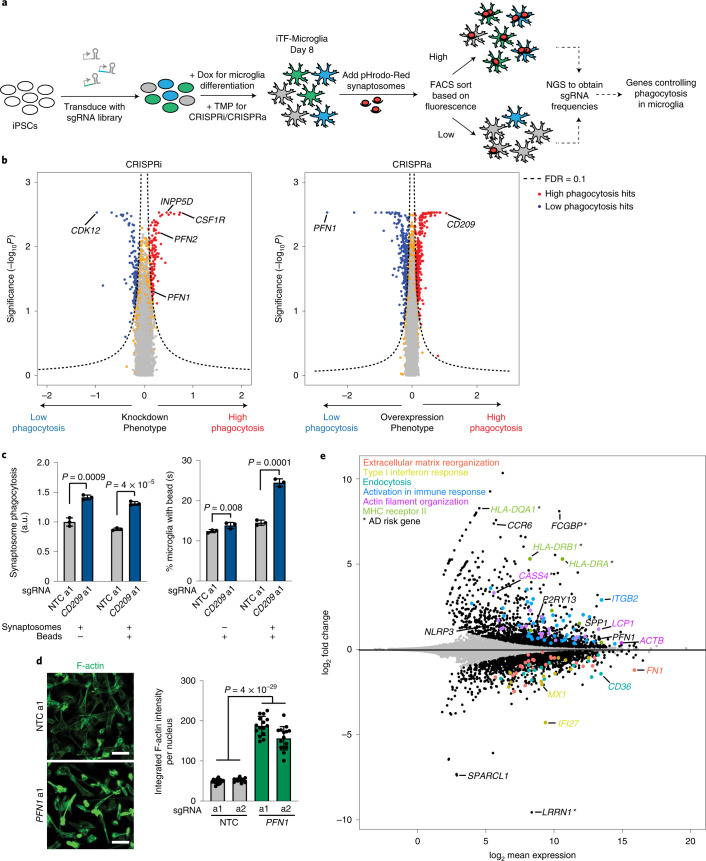
Fig. 5. Identification of modifiers of phagocytosis by CRISPRi and CRISPRa screens.
a, Strategy for modifier screen based on the uptake of pHrodo-labeled rat synaptosomes. b, Volcano plots summarizing knockdown and overexpression phenotypes and statistical significance (two-sided Mann–Whitney U-test) for genes targeted in the pooled phagocytosis screens. Left, CRISPRi screen; right, CRISPRa screen. Dashed lines, Gene Score cut-off for hit genes (FDR = 0.1). Hit genes are shown in blue (knockdown decreases phagocytosis) or red (knockdown increases phagocytosis), nonhit genes are shown in orange and ‘quasi-genes’ generated from random samples of NTC sgRNAs are shown in gray. Hits of interest are labeled. c, Competitive phagocytosis assay to test substrate specificity of CD209 overexpression. Flow cytometry measurement of phagocytosis of pHrodo-Red-labeled synaptosomes (left, either synaptosomes alone or together with beads) and green, fluorescent beads (right, either beads alone or together with synaptosomes) by iTF-Microglia expressing either NTC sgRNAs or sgRNAs targeting CD209. Values represent mean ± s.d. of n = 3 biological replicates. Data were analyzed using two-tailed Student’s t-test. d, Representative fluorescent images demonstrating higher F-actin staining in CRISPRa iTF-Microglia at day 8 with PFN1 sgRNAs compared with NTC sgRNAs (left). Scale bar, 50 µm. Right, integrated F-actin intensity per cell of CRISPRa iTF-Microglia at day 8 with PFN1 sgRNAs or NTC sgRNAs. Mean ± s.d., n = 5 fields of view from 3 different wells per sgRNA. P values from two-tailed Student’s t-test. e, Transcriptomic changes caused by PFN1 overexpression in day 8 iTF-Microglia (n = 3 biological replicates). DEGs (Padj < 0.05, two-tailed Student’s t-test) are labeled in black. Other colors label genes associated with specific pathways that are discussed in the main text. *AD risk genes. a1, a2 refer to independent CRISPRa sgRNAs targeting the indicated genes.

