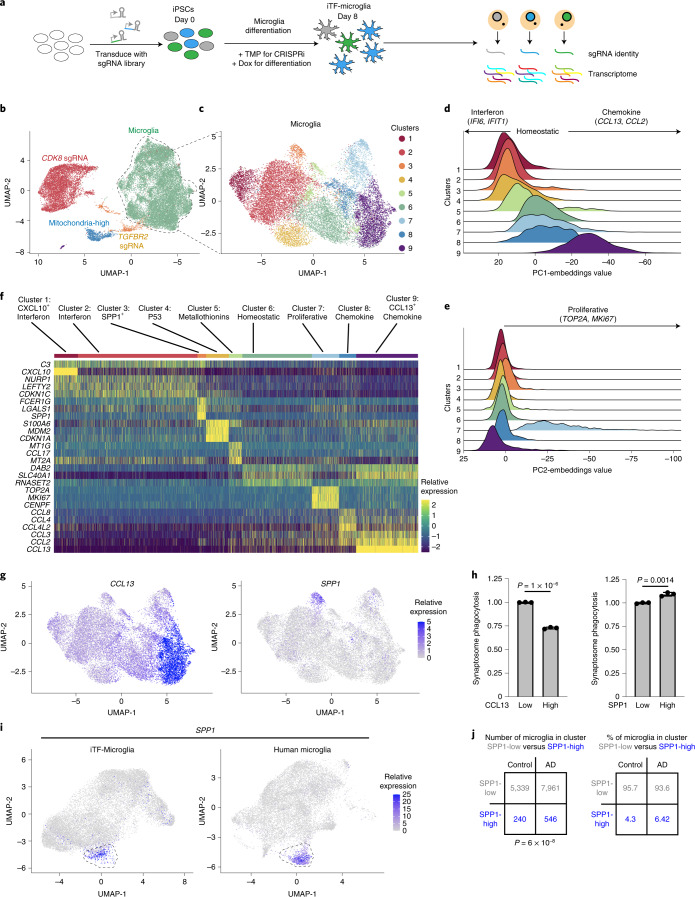
Fig. 6. scRNA-seq reveals distinct and disease-related microglia subclusters.
a, Strategy for the CROP-seq screen. IPSCs expressing inducible CRISPRi machinery were transduced with a pooled library of 81 sgRNAs and CROP-seq vector pMK1334. iPSCs are differentiated to iTF-Microglia and subjected to scRNA-seq to obtain single-cell transcriptomes and to identify expressed sgRNAs. b, UMAP of the 28,905 cells in the post-quality control CROP-seq dataset. Cells are colored by sgRNA (CDK8, red; TGFBR2, orange) and cells with a high percentage of mitochondrial transcripts (blue). Microglia are labeled in green. Each dot represents a cell. c, UMAP depicting the 9 different clusters within the 19,834 microglia. Each dot represents a cell. The cells are color-coded based on their cluster membership. d,e, Ridge plots depicting iTF-Microglia clusters along PC1 (d) and PC2 (e). PC1 spans inflammation status (interferon activated–homeostatic–chemokine activated) while PC2 spans proliferation status. f, Heatmap of iTF-Microglia clusters 1–9 and the relative expression of the top three DEGs (based on log2 fold differences in expression) of each cluster. g, UMAP of distinct marker expression of CCL13 (left) and SPP1 (right). CCL13 is a marker for cluster 9 and SPP1 is a marker for cluster 3. Cells are colored by the expression levels of the indicated gene. h, Phagocytic activity of iTF-Microglia in different states. Flow cytometry measurement of phagocytosis of pHrodo-Red-labeled synaptosomes (left, phagocytosis in CCL13high and CCL13low iTF-Microglia; right, phagocytosis in SPP1high and SPP1low iTF-Microglia). Values represent mean ± s.d. of n = 3 biological replicates; P values from two-tailed Student’s t-test. i, Integration of single-cell transcriptomes of iTF-Microglia and microglia from post-mortem human brains3. In the integrated UMAP, iTF-Microglia (left) with high SPP1 expression and human brain-derived microglia with high SPP1 expression (right) form a cluster (dashed outline). j, In brains from patients with AD, a higher fraction of microglia is in the SPP1high cluster compared with control brains (data from Olah et al.3; P value from two-sided Fisher’s exact test).

