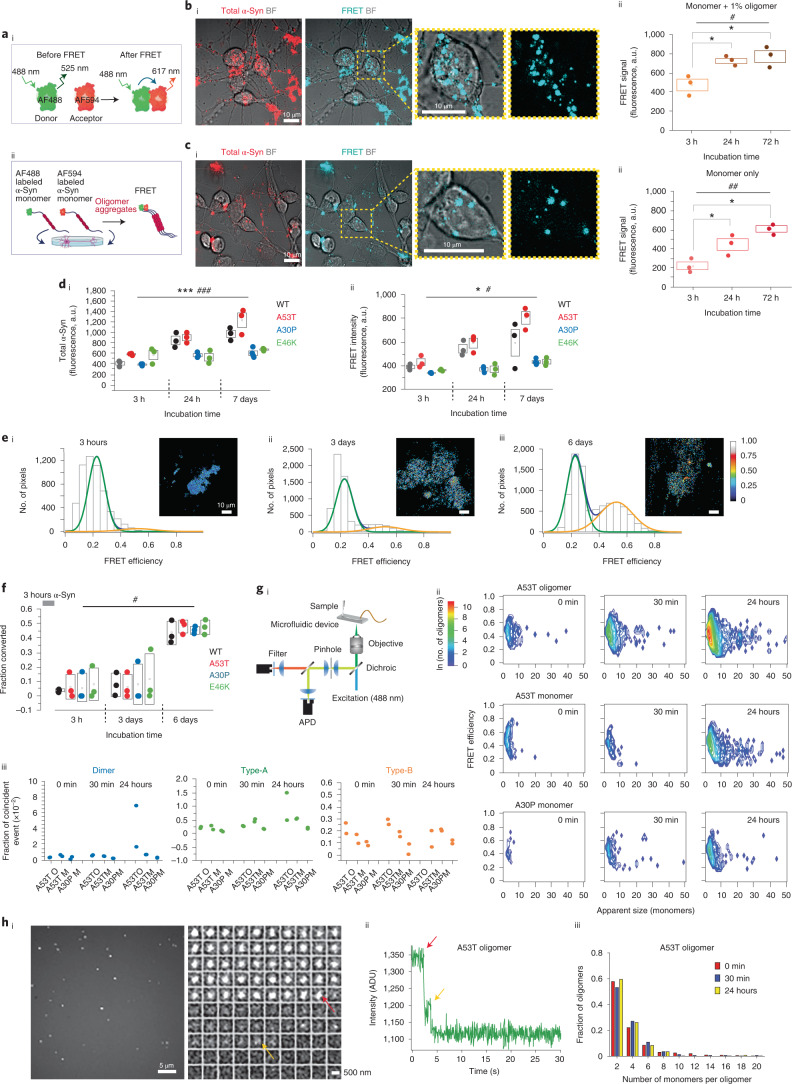
Fig. 1. FRET sensor detects rapid intracellular oligomerization of A53T α-Syn.
ai, Schematic illustration showing how FRET sensor detects aggregation. aii, AF488-α-Syn and AF594-α-Syn monomers are applied to cells, and the FRET signal is detected. bi, Representative bright-field (BF) FRET images after 72-hour incubation with oligomers. bii, Application of 500 nM WT oligomeric α-Syn exhibits detectable FRET, which increases over time (n = 3 independent experiments). ci, Representative FRET images after 72-hour incubation with monomers. cii, Application of 500 nM monomeric α-Syn exhibits low FRET signal initially, followed by an increase in FRET over time (n = 3 independent experiments). di,dii, A53T monomer exhibits the highest intracellular accumulation of α-Syn and the highest intracellular FRET intensity over time (n = 3 or 4 independent experiments). ei–eiii, FRET efficiency was calculated and binned into histograms that were fit to two Gaussian distributions. After 3 hours, only a low-FRET-efficiency population (centered at E = 0.24) was present. After 3 days, a second higher-FRET-efficiency population appeared (E = 0.48), and the fraction of this increased over time. f, Fraction of the high-FRET-efficiency population (out of total FRET events) increases over time for the WT and all mutants. Fitting error is shown in Extended Data Fig. 2c (n = 3 or 4 independent experiments). gi, Single-molecule confocal microscopy under conditions of fast flow used to analyze cell lysates. gii, 2D contour plots of approximate oligomer size and FRET efficiency after application of the monomers and oligomers. Both the number of events and the size of the oligomers increase over time in all cases. giii, Number and type of oligomeric events in cell lysates from the monomer/oligomer-treated cells. Data are represented as data ± s.d., as fraction of coincident events (n = 2 independent samples). Fitting error is shown in Extended Data Fig. 3a. hi, Photobleaching step analysis for A53T-oligomer-treated cells. hii, Step-fit example of a single A53T oligomer (24 hours) intensity trace (intensity is plotted as analogue-to-digital units (ADU)). hiii, Each step indicates photobleaching of a single fluorophore, from which oligomer size can be estimated. Note: Data are represented as data ± s.e.m. (box) unless otherwise mentioned. Detailed statistical information is shown in Supplementary Table 1. See also Extended Data Figs. 1–4. a.u., arbitrary units.

